Memo
Climate-Risk Intelligence: Where Physical Modeling Becomes Enterprise Software
Yanni Bills
April 15, 2026
1 Thesis
A coarse grained sampling of climate sentiment indicates a broad upward trend in the cost of climate hazard events. However, the past couple of years, unnoticeable through the large Planck-length lens, have served as a bellwether of a dramatic shift in the trajectory of attention paid to opportunities meant to service this unabating, broad strokes trend. Across the industries of insurance, asset management, banking, real estate, and infrastructure, the pains induced by climate hazard events are growing, manifesting as more frequent operational inhibition and losses altogether. Traditional services offering risk-management adaptation and resilience methodologies struggle to deal with the effects of climate risk, thus opening up a vacuum in which a serviceable need lacks a pertinent service provider. The filler of this service void therefore lies in companies that provide an end-to-end climate-risk intelligence service that solves the principal problem of translating physical hazards into decision-grade advice for adaptation actions. It then follows that the venture opportunity is manifested within companies that most effectively identify and categorize physical hazards, most accurately aggregate data from predictive modeling, most tactfully perform a large-deviations-resolving probabilistic analysis, and most elegantly present the risk exposure in the form of an output that is readily interpretable as a course of action to mitigate losses before they occur. Companies that provide generic forecasts with unsophisticated analyses and largely cosmetic risk categorization scores are not to be considered of venture-scale caliber.
2 Sector Definitions and Exclusions
2.1 Definitions
The taxonomy we employ follows, mutatis mutandis, the nested-subset formulation outlined in the MSCI (formerly Morgan Stanley Capital International) manuscript by Lee et al. [17]. Namely, the highest-level notions are denoted as follows:
- Adaptation: Actions taken to adjust to actual or expected physical climate hazards.
- Resilience: The resulting capacity to withstand, absorb, recover from, or continue functioning despite those hazards.
These terms encompass two parts of the same pipeline to strengthen a company’s fortitude as it pertains to physical risks. It then follows to address the particular angles of approach to this pipeline. To this end, one must delineate between internal risk management and external revenue generation. Respectively, these encompass adaptive measures taken by companies to mitigate physical risk losses or exposure, and active provision of revenue-generating solutions that service the need to mitigate said risk manifestations. Given that this is a sector memo, we opt to focus on the external revenue generation sub-category.
The aforementioned MSCI manuscript [17] provides an overview of adaptation and resilience products in a suite of market sectors. We forego this decomposition as it is not necessary for the express purpose of this memo. Additionally, to a varying extent, climate-risk intelligence can manifest within product categories that appear under different names for all the listed sectors. Thus, a succinct umbrella category that encapsulates climate-risk intelligence can be denoted by physical risk analytics.
Climate-risk intelligence refers to a sector of companies that provide model-, data-, or AI-driven analytics for quantifying, forecasting, pricing, and communicating exposure to physical climate hazards. These tools may estimate asset-level risk, operational disruption, or financial loss; translate probabilistic hazard information into interpretable decision-support outputs; and recommend or inform adaptation, risk-transfer, capital-planning, or operational-resilience measures.
2.2 Exclusions
Companies offering products of the following general form will not be considered:
- Products whose primary value lies in physical technology, hardware deployment, or direct monitoring of a customer’s physical system, rather than model-, data-, or AI-driven risk analytics.
- This includes physical adaptation solutions themselves, such as flood barriers, cooling systems, irrigation hardware, drainage infrastructure, or wildfire-resistant materials.
- General weather, hazard, or extreme-event forecasting products that do not translate forecasts into risk exposure, potential loss, adaptation planning, or operational decision support.
- This includes generic geospatial analytics products without a clear climate-risk analytics component.
- Products focused primarily on emissions accounting, sustainability reporting, compliance, or transition-risk disclosure without a substantive physical-risk analytics layer.
- Products focused on carbon credits, emissions reduction, or energy-transition planning.
- Insurance or risk-transfer products whose core offering is not an analytical software layer, pricing engine, or climate-risk model.
- Bespoke climate-risk reports offered by traditional consulting firms without a scalable software, data, or modeldriven product.
- Emergency-response or disaster-management platforms whose primary function is post-event coordination, communication, evacuation, or recovery rather than pre-event risk quantification or adaptation decision support.
It should also be noted that although some delineate “climate risk analytics” from “weather intelligence modeling” by nature of time horizons, this memo will not do so. Such a distinction is superfluous for a sector-wide description, and thus it is expected that the reader understands the differences between weather and climate. Climate-risk intelligence, for these intents and purposes, will include companies with products servicing all predictive time scales.
3 Why Now?
3.1 Main Ideas
The timing for climate-risk intelligence is driven by four coalescing forces:
i) rising realized losses from physical climate hazards,
ii) growing corporate recognition that physical risk is financially material,
iii) a gap between exposure and formalized risk-management capacity, and
iv) insurers and asset owners beginning to convert physical risk into pricing, underwriting, capital-allocation, and advisory workflows.
3.2 Greater Detail
Silicon Valley Bank’s (SVB) 2026 climate-tech report [1] indicates that the cost of \(\$ 1 \mathrm{~B}\) US weather and climate disaster events adjusted for inflation (2026 dollars) has steadily increased each decade since the 1980s. Even in the last 10 years, it is noted that, collectively, climate and weather disasters have cost \(\$ 1.5 \mathrm{~T}\) in direct damages to property and crops. This, however, is only the broad strokes picture of what the trend in the market response might look like. It follows to increase the temporal resolution and look more closely at where the arrow is pointing.
In Q4 of 2024, MSCI published the findings from a survey of 350 senior investors and risk managers across many financial institutions with heterogeneous knowledge pertaining to climate [18]. Aggregated in this report are their responses to questions involving the future of climate policy and the impacts of climate-related hazards. Its greatest takeaway is the great spread and lack of conformity exhibited by the sampled group’s responses to almost every question. The only notable majorities observed were manifested in the form of open-ended agreement with broad statements that climate risks are creating economic fallout and are growing ( \(57 \%\) agree), as well as the notion of a net-zero economy by 2050 being unlikely ( \(69 \%\) agree). However, that a minority ( \(48 \%\) ) of those surveyed believed that climate risks were not priced in paints a picture of mercurial agnosticism with respect to said risks in the
future at best. The sentiment may have reflected the status quo of mainstream messaging for the past 20 years of a climate-focused investment cycle, but the reality is that the posture of financial professionals did not indicate a great sense of urgency as recently as nearly two years ago. This ambivalence was mirrored, at least directionally, by the broader climate-tech funding environment: private investors were pulling back from the category as a whole, even as the physical-risk problem itself continued to intensify (see the figure below from [1]).
Climate Tech Fundraising Continues to Decline
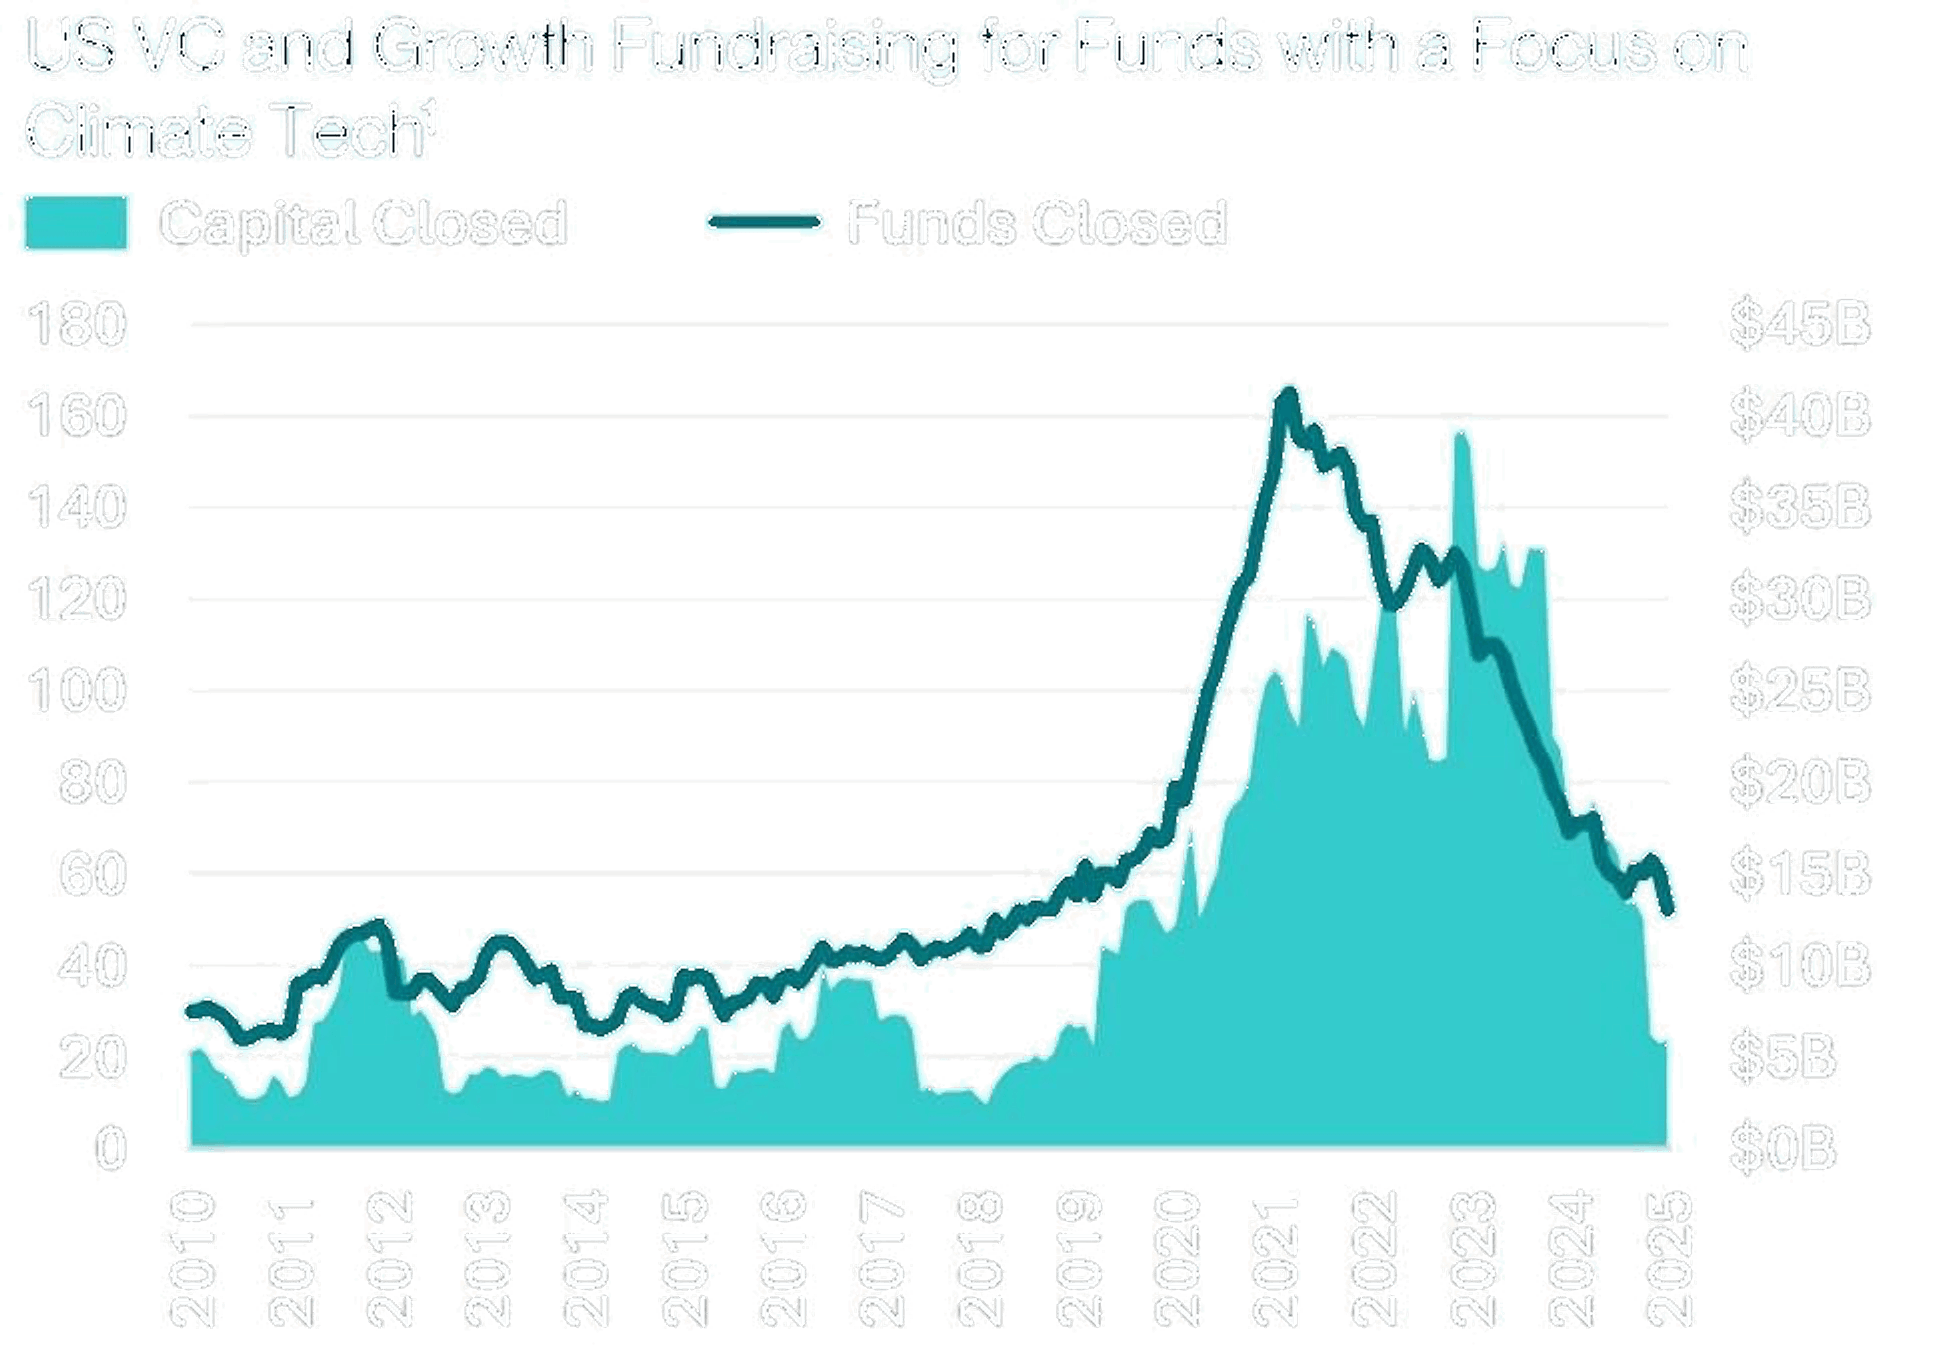
The first figure from slide 7 of [1] reproduced here.
To address the question of “why now,” one must then investigate the trends more thoroughly and also reconcile what has changed between 2024 and now (2026). Thankfully, MSCI has addressed both of these gaps in subsequent works.
Q4 of 2025 saw MSCI bestow upon the engaged reader a manuscript outlining the results from a survey of 550 companies in 15 countries across nine industries at highest exposure to physical risk [19]. Here, the results are more striking: over \(\mathbf{8 0} \boldsymbol{\%}\) of surveyed companies admit that extreme weather events have inhibited operations or added to overall costs since 2020. Furthermore, \(\mathbf{9 9 \%}\) of companies surveyed said that they assessed risks from extreme weather, all while \(\mathbf{8 5} \boldsymbol{\%}\) of them estimated potential losses from it. Evidently, this report is dealing with far more substantive majorities as it pertains to the bellwether for a market-wide climate-risk obsession. But how exactly did these findings convert to actualized change? This is addressed by the figure below (Exhibit 4 from [19] reproduced here).
Exhibit 4: Proportion of companies adopting frameworks for physical-risk management (% of companies surveyed)
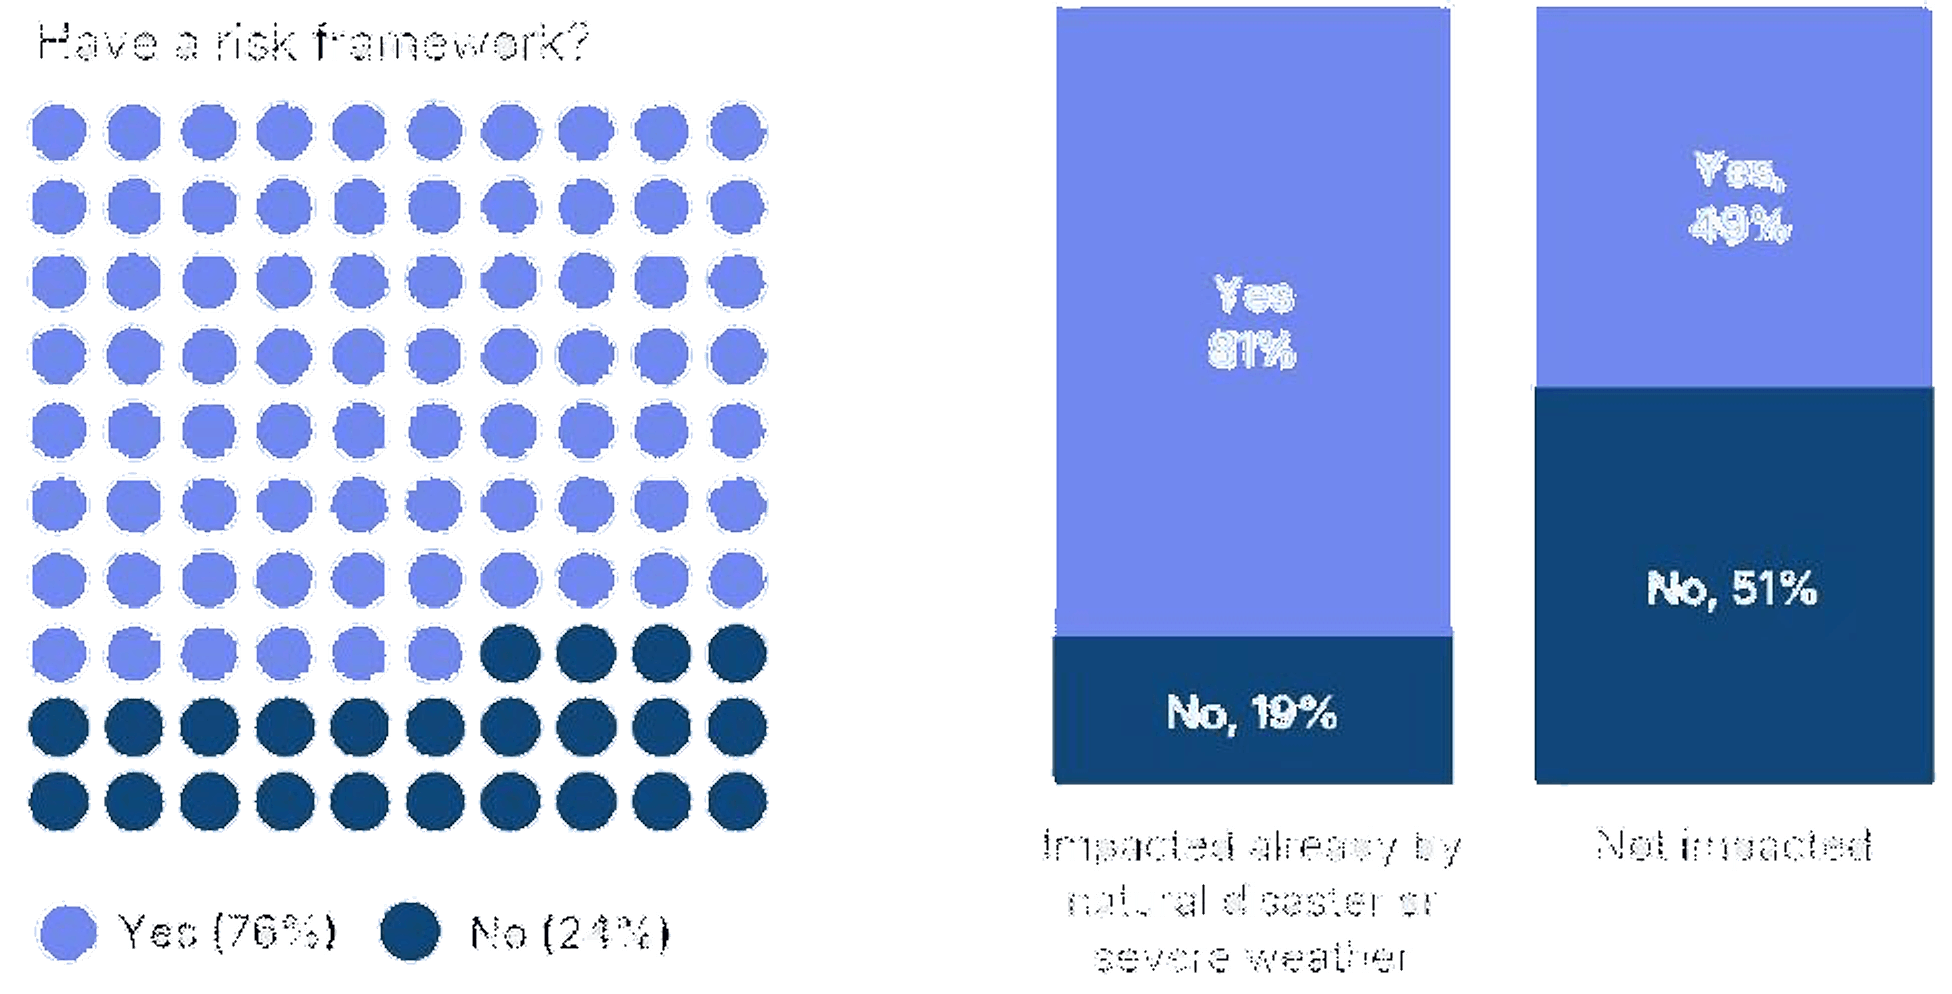
Exhibit 4 from slide 8 of [19] reproduced here.
The figure is self-explanatory at face value, although it does not explicitly denote what percentage of companies had already experienced a climate hazard event. Of course, the manuscript notes that \(76 \%\) of companies surveyed reported having a framework for managing physical risk. This means that 418 companies have done so. In the spirit of a back-of-the-envelope computation, if \(N\) companies have already been impacted by a disaster, then
which yields \(N \approx 464\) (approximately \(84 \%\) of all companies surveyed). This number is to be expected given that the companies surveyed were denoted as those with “high exposure” to physical risk. This suggests, though it does not prove, that firms outside the highest-exposure categories may be even less prepared to formalize physical-risk management before direct experience forces the issue. This is to say that a demand for physical-risk adaptation and resilience measures, as climate hazard events begin to affect more companies in broader categories, is almost surely imminent. And those outside of the highest-physical-risk category will look to companies of the creed of those surveyed for inspiration when designing their own risk management frameworks. This conjectural logic train is worth following given that AI-driven forecasting and predictive analytics were among the most frequently cited corporate investments by those surveyed (see the figure below).
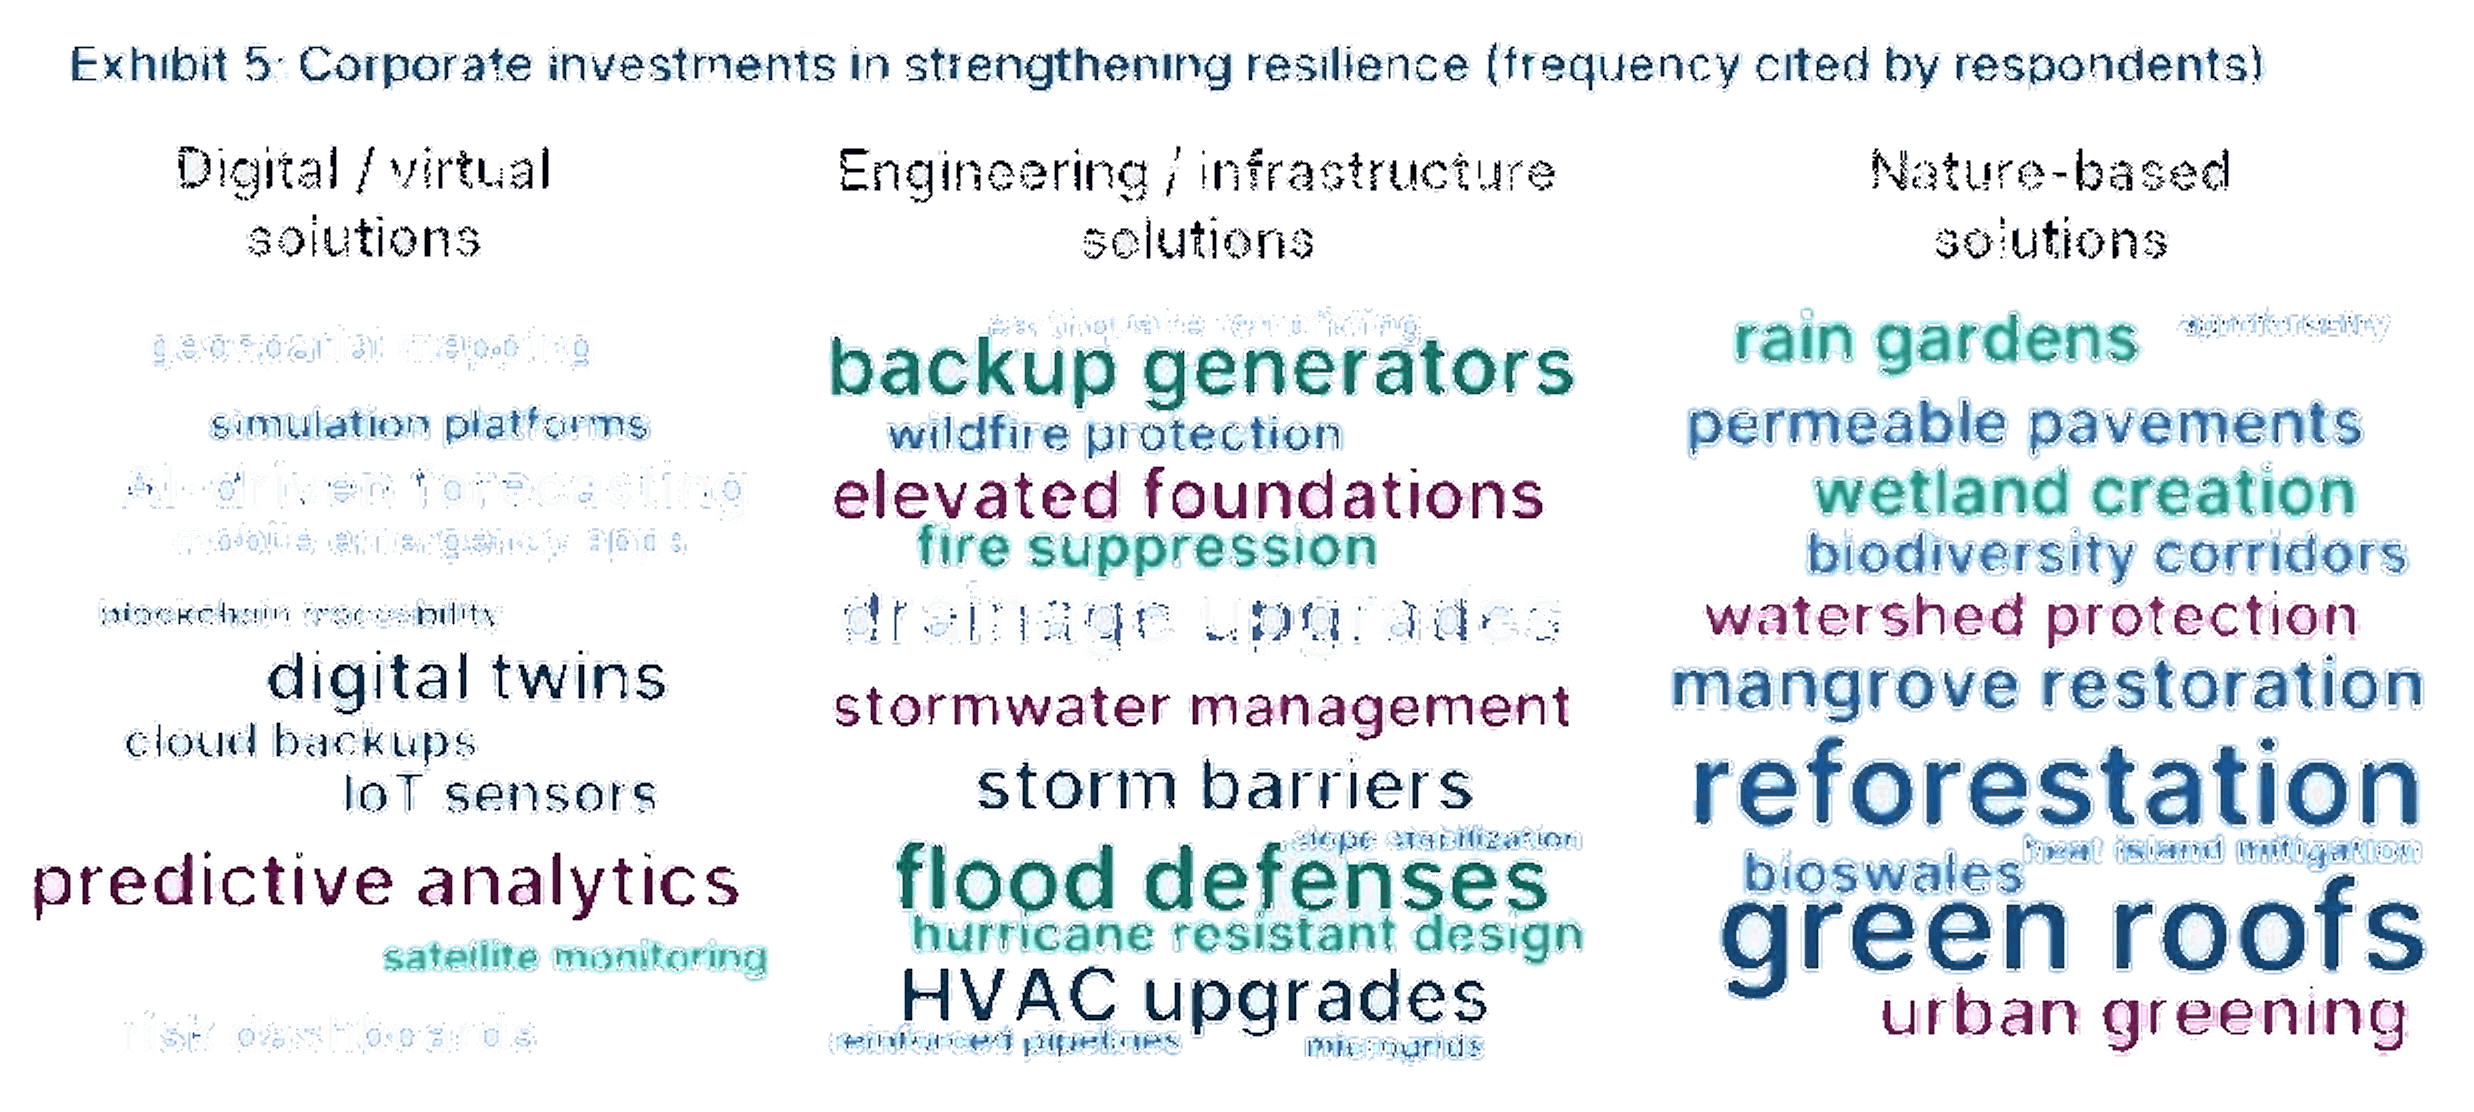
Exhibit 5 from slide 9 of [19] reproduced here.
Indeed, corporations desired physical-risk management services with a capability to make useful predictions. The following November of that same year, MSCI published a research paper outlining a survey (in collaboration with Swiss Re Risk Data Solutions) of over 11,000 companies and 500,000 physical assets underpinning the portfolios of 18 leading asset owners, representing \(\$ 4\) T USD in assets under management [20]. This time, there was no conditioning of the sample group upon the quality of having higher exposure to physical risk. The recently described conjecture is corroborated by this report, as \(89 \%\) of assets were recorded as facing multiple overlapping hazards, \(55 \%\) of companies were severely exposed to physical risk hazards at that time, and only \(30 \%\) of those exposed firms formally disclosed integration of physical risk management. The year of 2025 saw the problem of physical risk exposure more clearly explicated by such studies, with a clear gap which new companies ought to service. This is where the sector of climate-risk intelligence stakes its claim.
In February of 2026, MSCI published their most recent piece on climate risk, detailing their findings after surveying over 50 property and casualty insurers globally [21]. The most notable results include that
- \(\mathbf{9 1 \%}\) of insurers believe there are opportunities in physical risk management advisory services, and
- \(\mathbf{6 8 \%}\) of insurers surveyed in Europe admit to integrating physical risk into overall risk management with only \(\mathbf{3 6 \%}\) and \(\mathbf{3 3 \%}\) saying the same in APAC and North America respectively.
These statistics exist in concert with the fact that insured losses from climate hazard events have exceeded \(\$ 100 \mathrm{~B}\) USD in 2025 for the sixth year in a row, with estimates for asset damage and lost-revenue from physical risk rising up to \(\$ 4.6 \mathrm{~T}\) USD by 2050 [32]. The early buyer base is likely to consist of insurers, reinsurers, asset managers, and other large corporations with exposed physical assets or supply chains. It remains to see what will happen to the sector as the broader swath of companies, which will also desire similar services, catches on. It follows to expect that now is certainly the time to pay close attention to venture-scale companies in the sector of climate-risk intelligence while the demand for a very particular class of products and services is still growing.
Physical climate risk is asset-specific, probabilistic, multi-hazard, and emerges from highly nonlinear physical systems, making it difficult to translate into financial or operational decisions without specialized analytics. The recent progress in AI/ML-based weather and Earth-system modeling should therefore be understood with some precision. These models appear to have materially lowered the computational cost of short-horizon forecasting, and in certain regimes they now rival or exceed traditional numerical systems for lead times on the order of days rather than decades [15, 4]. This is non-trivial, as the paradigm shift in climate-risk intelligence is that useful probabilistic guidance can now be produced more cheaply, more frequently, and by a larger set of actors than those with access to national-scale HPC infrastructure.
The harder problem, however, remains unresolved. Enterprise buyers rarely desire a standalone weather prediction service. Rather, they want to know how a changing hazard distribution maps onto an asset, a balance sheet, or an operational decision. This requires three translations: from atmospheric state to local hazard, from local hazard to asset-level vulnerability, and from asset-level vulnerability to financial or operational loss. AI weather models may improve the first translation, especially at shorter lead times, but they certainly do not solve the latter two. They also still fail to obviate the fundamental difficulty that longer-horizon physical-risk analytics must reason beyond a short historical record, under non-stationary boundary conditions, with sparse validation data for extreme events. The sector is thus still technically unsettled. Some companies will lean on large ensembles and probabilistic stress testing while others will combine climate-model outputs with catastrophe models, proprietary asset data, and vulnerability functions. Still others may wait for AI-native Earth-system models to mature. It follows that the relevant diligence question is whether a company has a credible method for converting uncertain, multi-horizon physical hazard information into decision-grade risk analytics.
Taken together, these trends suggest that climate-risk intelligence is moving from a niche climate analytics category into a broader layer of risk infrastructure. Insurers are a natural early buyer because physical hazards directly affect underwriting, pricing, reinsurance, and risk-transfer markets. However, the same need is likely to extend to asset owners, infrastructure operators, real estate firms, and more. The investable opportunity lies in companies that can translate probabilistic, asset-level physical hazard information into decision-grade outputs for pricing, capital planning, adaptation, and operational resilience.
4 Buyer Categories
Climate-risk intelligence is not purchased by a generic “enterprise customer.” The strongest buyers are those for whom physical climate risk directly affects pricing, asset valuation, or operational continuity. The remainder of this
| Pain Point | Buyer | Willingness Pay | Use Case |
|---|---|---|---|
| Rising catastrophe losses and model uncertainty | Insurers / reinsurers | High | Underwriting, pricing, portfolio accumulation, risk-transfer design |
| Physical risk affects portfolio value and disclosure | Asset managers / owners | Medium-High | Portfolio screening, scenario analysis, capital allocation |
| Collateral and credit exposure to physical hazards | Banks / lenders | Medium-High | Loan-book stress testing, CRE/mortgage risk, capital planning |
| Asset damage, insurance costs, CapEx planning | Real estate / infrastructure owners | High for exposed assets | Acquisition diligence, resilience CapEx, exit valuation |
| Asset downtime and operational disruption | Utilities / energy / industrials | Medium-High | Grid/infrastructure resilience, outage planning, supply continuity |
| Disruption to logistics, suppliers, and facilities | Supply-chain-heavy corporates | Medium | Supplier risk screening, contingency planning, operational resilience |
| Infrastructure exposure and community resilience | Public sector / municipalities | Medium, slower sales cycle | Hazard mapping, adaptation planning, emergency preparedness |
Table 1: Primary buyer categories for climate-risk intelligence products.
section further explicates the three buyer categories with the clearest near-term budget logic. Namely, these are insurers and reinsurers, asset managers and asset owners, and banks and lenders.
4.1 Insurers and Reinsurers
Insurers and reinsurers are the cleanest early buyer category because physical climate risk already sits inside their core economic machinery of underwriting, pricing, and portfolio risk management. As insured natural catastrophe losses continue to exceed \(\$ 100 \mathrm{~B}\) annually, the need goes beyond mere recognition that hazards are worsening. Namely, it is far more desirable to determine which risks can be priced, transferred, or avoided altogether [32]. This makes
climate-risk intelligence valuable insofar as it improves risk selection, accumulation management, and the design of new products like parametric coverage. MSCI’s 2026 insurer survey suggests that this change in the baseline for capabilities of the demanded product is already underway, with \(91 \%\) of surveyed insurers seeing opportunities in physical-risk management advisory services and \(58 \%\) citing parametric products as a key opportunity [21]. The budget logic is correspondingly direct: these tools can attach to actuarial, underwriting, and reinsurance workflows. For this buyer category, a product’s value is actualized when it can improve the insurer’s ability to convert mercurial hazard information into differentiated pricing, loss avoidance, or customer-facing resilience advice.
4.2 Asset Managers and Asset Owners
It is natural to expect that asset managers and asset owners are a prominent buyer category because physical climate risk increasingly affects portfolio allocation strategies and broader stewardship. Rather than directly pricing in physical risk in a manner akin to insurers, they must determine whether a given asset, issuer, or portfolio is improperly priced relative to its exposure to myriad climate hazards. The subsequent demand is then for a product that is capable of translating often localized, asset-level exposure into capital-allocation strategies and scenario analysis for a portfolio. As was mentioned before in a description of [20], the portfolios of 18 leading asset owners saw \(89 \%\) of assets facing multiple overlapping hazards, while only \(30 \%\) formally disclosed integration of physical-risk management. These key findings were certainly prescient, as it is now understood that the budget logic therefore sits within portfolio analytics, general risk management practices, ESG/climate teams, and investment diligence. For this buyer category, climate-risk intelligence comes online if it helps distinguish between superficially exposed assets and genuinely impaired ones, thereby informing reallocation, divestment, or resilience-capex decisions.
4.3 Banks and Lenders
Banks and lenders are another natural buyer category because physical climate risk can impair collateral values, borrower cash flows, and loan-book performance. The pertinent use case involves the integration of hazard exposure into credit underwriting, portfolio stress testing, and collateral assessment. This is especially salient for mortgage, infrastructure, and project-finance portfolios, where the geography of an asset is inextricable from its risk profile. The OSFI/AMF standardized climate scenario exercise is useful here, as it frames physical-risk assessment around geospatial data, exposure mapping, and loss estimates that can be incorporated into financial-risk analysis [28]. The budget logic therefore sits within credit risk, enterprise risk management, regulatory stress testing, and portfolio analytics. For this buyer category, climate-risk intelligence becomes unavoidably necessary if it can connect physical hazard information to probability of default, loss given default, collateral impairment, or loan-pricing decisions.
5 Market Opportunity
5.1 Sizing Caveat
The market for climate-risk intelligence is difficult to size precisely because it is not a cleanly bounded software category. It is nested within broader markets for climate adaptation, resilience technology, insurance analytics, catastrophe modeling, geospatial intelligence, weather intelligence, and enterprise risk software. As a result, market size estimates are treated as Lagrangian vectors with directionality rather than definitive scalars, if you will. Conjuring up an authoritative total addressable market (TAM) is not the principal focus. Rather, we endeavor to understand whether the category is large enough, urgent enough, and close enough to budgeted workflows to support venture-scale outcomes.
5.2 Top-Down Market Context
From a top-down perspective, climate-risk intelligence sits inside a much larger adaptation and resilience economy. GIC and Bain estimate that annual revenues from selected climate adaptation solutions could grow from roughly \(\$ 1 \mathrm{~T}\) today to \(\$ 4\) T by 2050, while McKinsey estimates that technologies supporting climate resilience and adaptation could represent \(\$ 600\) B- \(\$ 1\) T in addressable markets by 2030 [40, 36]. BCG and Temasek similarly frame climate adaptation and resilience as a trillion-dollar private-market opportunity, with projected annual adaptation investment demand reaching \(\$ 0.5 \mathrm{~T}-\$ 1.3 \mathrm{~T}\) by 2030 when developed markets are included [27]. This is in confluence with the fact that private investors continue to inadequately capitalize upon this growing opportunity by nature of the specialized knowledge needed to understand the space. That aside, these figures should not be read as the TAM for climaterisk intelligence itself. Rather, they indicate that the broader adaptation and resilience economy is large enough for analytical infrastructure to become a substantive layer to it all. Indeed, the range of subsectors and subsectors’ pertinent solutions outlined in [27] are clearly delineated in a manner suited to differentiating more physical products. However, underpinning every single subsector is a place for physical-risk analytics and intelligence to present itself as
a solution; ergo, the market context estimates can be reasonably extrapolated to say something about the climate-risk intelligence sector’s market opportunity (BCG suggests an annual CAGR of \(15 \%\) for climate intelligence solutions, being the largest growth rate of all solutions discussed in their report).
5.3 Pure-Play Climate-Risk Analytics Estimates
More narrowly, third-party market reports suggest that the pure-play climate-risk analytics market is still relatively small but burgeoning quickly in its growth. Fortune Business Insights estimates the climate-risk analytics market at roughly \(\$ 1.8 \mathrm{~B}\) in 2025 and projects growth to \(\$ 7.7 \mathrm{~B}\) by 2034, while Technavio estimates the climate-risk analytics platforms market at roughly \(\$ 905 \mathrm{M}\) in 2025 with a projected \(17.8 \%\) CAGR through 2030 [11, 34]. These estimates should be treated cautiously because market-report methodologies are often opaque and category definitions vary non-trivially. But given that we were quite liberal in our definition of the climate-risk intelligence sector, it can at least be suggested that subsets of this sector may exhibit these traits. Furthermore, these reports support a directional notion that climate-risk intelligence is a far-from-saturated software market that is expanding at venture-relevant growth rates.
5.4 Interpretation for Venture-Scale Companies
It has already been discussed that the products stipulated to be offered by a climate-risk intelligence sector have the potential to underpin all of the obvious subsectors in the broad category of customers in need of adaptation and resilience measures. It is by this metric that one can furnish an argument to extrapolate estimates in a top-down manner to growth potential of this sector. However, for venture investors, the question of greatest interest is whether a subset of customers making recurring, high-value risk decisions will pay for high-quality analytics that improve adaptation and resilience measures as they pertain to climate hazard events. The most attractive companies will be those that can service the bare minimum need for credible probabilistic analytics while also seamlessly integrating with and proliferating throughout the budgeted workflows of all potential customers. The manner in which this is done will be a manifestation of climate-risk intelligence companies’ taste coupled with a deep understanding of the precise needs of the end user. An ideal company in climate-risk intelligence will fit in to workflows seamlessly while slowly, but surely, becoming an inextricable component of the customer’s holistic operational structure-a foundational layer. To make a long story short, companies that sell nothing more than unintelligible exposure scores with no tractable means of turning the numbers into a plan for action will not be worth entertaining.
6 Technical Architecture
6.1 The Core Translation Problem
Will a hazard occur? If reality were a measure preserving system, then Poincaré would proclaim “almost surely.”
It goes without saying that many sorts of climate hazards may occur at any given moment with non-zero probability. Even if that probability is small, and the hazard of relevance has yet to afflict a particular asset, the lack of certainty surrounding it does not mean that these events are financially immaterial. Thus, it is a pointless endeavor to ask the “if” question. Of far greater importance are the following questions:
- Which sort of hazard threatens this entity?
- When might this hazard be expected to arise?
- On what quasi-cyclic time scale might this hazard be expected to recur?
- How would the entity be affected if the hazard occurred?
- What decision changes if the hazard is measured more accurately?
In the wake of such questions, one should duly recognize that the climate-risk intelligence category most axiomatically encodes services that ideally translate unrealized physical realities into decisions-grade advice. In broad strokes, this metaphorical assembly line has the following form:
As a service along this chain operates, each link serves as a potential weak point. Namely, each step of the translation process permits an opportunity for loss of information by nature of the discretionary manner in which the company’s product performs its duties. Indeed, a pedantic individual would proclaim that “all models are wrong.” This is true, but an even more pedantic individual would supersede that claim by saying that “some are useful.”
This is also true, and the logic chain attributed to climate-risk intelligence companies does not circumvent this reality.
The manner in which the hidden mechanistic structure operates is the one and only form of product differentiation on the back end. At the same time, however, the presentation and explication of courses of action necessary for optimal adaptation to hazards is another on the front end. The products offered in this space are expected to streamline the aforementioned logic chain while also reconciling both of the differentiating factors mentioned above.
6.2 Forecasting Regimes
There are three forecasting regimes that we choose to describe for the purposes of this section. They are delineated by the length of time horizon over which analytics are provided.
6.2.1 Short-Term
This forecasting regime typically resides within the time-scale of events that happen within five to ten days after a particular prediction origin. One would refer to this time-scale as that which encodes weather, not to be confused with the more grandiose notion of climate.
According to the National Oceanic and Atmospheric Administration (NOAA), the best of weather prediction models are correct \(90 \%\) of the time within 5 days, \(80 \%\) of the time within 7 days, but only \(50 \%\) within 10 days [26]. Said weather prediction models are either the American GFS model or European ECMWF (IFS-HRES), both of which are deterministic. This means that upon being spun up by with a particular set of initial conditions, any re-runs of the same model with the same conditions will produce exactly the same results. Of course, the dynamics of Earth’s atmosphere are extremely chaotic and non-linear, with the known trait of sensitive dependence upon initial conditions. This means that even the tiniest of inaccuracies in measurements between initial conditions will see final atmospheric states that grow apart exponentially in time. Therefore, these models’ efficacy rests upon this chaotic behavior by constructing ensembles, thereby running the same model multiple times with different, but close, initial conditions to get a statistical distribution of likely outcomes. This physical phenomenon of chaotic dynamics serves to explain the very rapid drop-off in accuracy of weather predictions beyond five days of lead time.
The way in which a climate-risk intelligence company’s product treats this time-scale is relatively uniform across the sector. Before the recent years of rapid AI advancement, these numerical models were the only means by which to perform short-term weather forecasting. However, both GFS and ECMWF are extremely computationally expensive, thus requiring parallelized HPC environments to run and serve their purposes. In recent years, a more computationally tractable means of short-term weather forecasting has emerged in the form of AI/ML-driven models. Computationally, these are far cheaper to run. NeuralGCM, for example, was reported to produce physically consistent forecasts with accuracy comparable to best-in-class models across timescales from one- to fifteen-day weather forecasts to longer climate simulations [15]. This is not to say, however, that AI has solved climate-risk prediction. The takeaway is that differentiation at this horizon is likely to not depend heavily on access to a generic forecast per se. Rather, it is the front-end presentation of findings and courses of action that furnish any substantive differentiation for short-term forecasting.
6.2.2 Sub-seasonal to Seasonal
The sub-seasonal to seasonal regime occupies the awkward middle ground between initialized weather prediction and long-term climate-risk analysis. It generally concerns lead times from several weeks to several months, where deterministic forecasts of the precise atmospheric state have already lost much of their value, but probabilistic information about aggregate conditions may still be useful. On the surface, one can indeed recognize that the climatological seasonal cycle, and its subharmonics, admits very predictable behavior by nature of Earth’s orbital mechanics. However, the commercially relevant question is whether a coming month or season is likely to be anomalously hot, dry, or otherwise disruptive relative to historical expectation. Namely, the mean background state is not of principal importance; analysis for this time-scale begins at the second moment.
Predictability on these horizons arises from slowly varying boundary conditions and large-scale modes of variability. There are many such physical phenomena, pertaining to things like sea-surface temperature anomalies or ice albedo, that elicit perturbations to the predictable background cycles of interest. Indeed an understanding of these perturbations requires a probabilistic treatment such that any front-facing analysis interpretation ought to be framed as one in terms of distributions as opposed to specific forecasts.
For buyers, this horizon is most useful when decisions must be made before short-term forecasts become available. The technical bar is therefore different from that of short-term weather intelligence. Differentiation in this regime is
likely to depend on uncertainty communication and the ability to explicate probabilistic anomalies through the lens of customer-specific action items.
6.2.3 Long-Term
It is across this time-scale, which is beyond the year-long lead time of seasonal scales, that accurate prediction becomes most intractable. As mentioned in the short-term time-scale commentary, AI/ML models like NeuralGCM have achieved efficacy for equally or more accurate atmospheric state predictions than those of physics-based numerical weather prediction systems for lead times under five days. This trajectory of modeling advancement is meaningful because AI/ML-driven models are significantly less computationally expensive to run than the run of the mill counterparts. However, AI-native and hybrid models still require scenario treatment, uncertainty propagation, and validation against sparse tail-event data for long-horizon, decision-grade climate-risk analytics. Indeed, this time-scale is not well-suited for a treatment involving particular atmospheric state predictions. Rather, this regime becomes an exercise of changing hazard distribution projections in a statistical sense. Thus, ensemble-reliant projections remain the dominant framework for this use case.
Of relevance to historical baselines, hindcasts, and validation are the available data themselves. The lack of good geospatial climate data before the advent of the satellite era in the 1980s means that much of the data used to ground long-time climate projections introduces a lot of uncertainty. For example, the European Copernicus Programme’s ERA5 climate data set is regarded as one of, if not the, best high-resolution climate data sets. Despite its impressive reanalysis engine coalescing data assimilation and physical consistency, it still admits a fairly large amount of ensemble spread (especially closer to the poles) in the pre-satellite era (see the figure below).
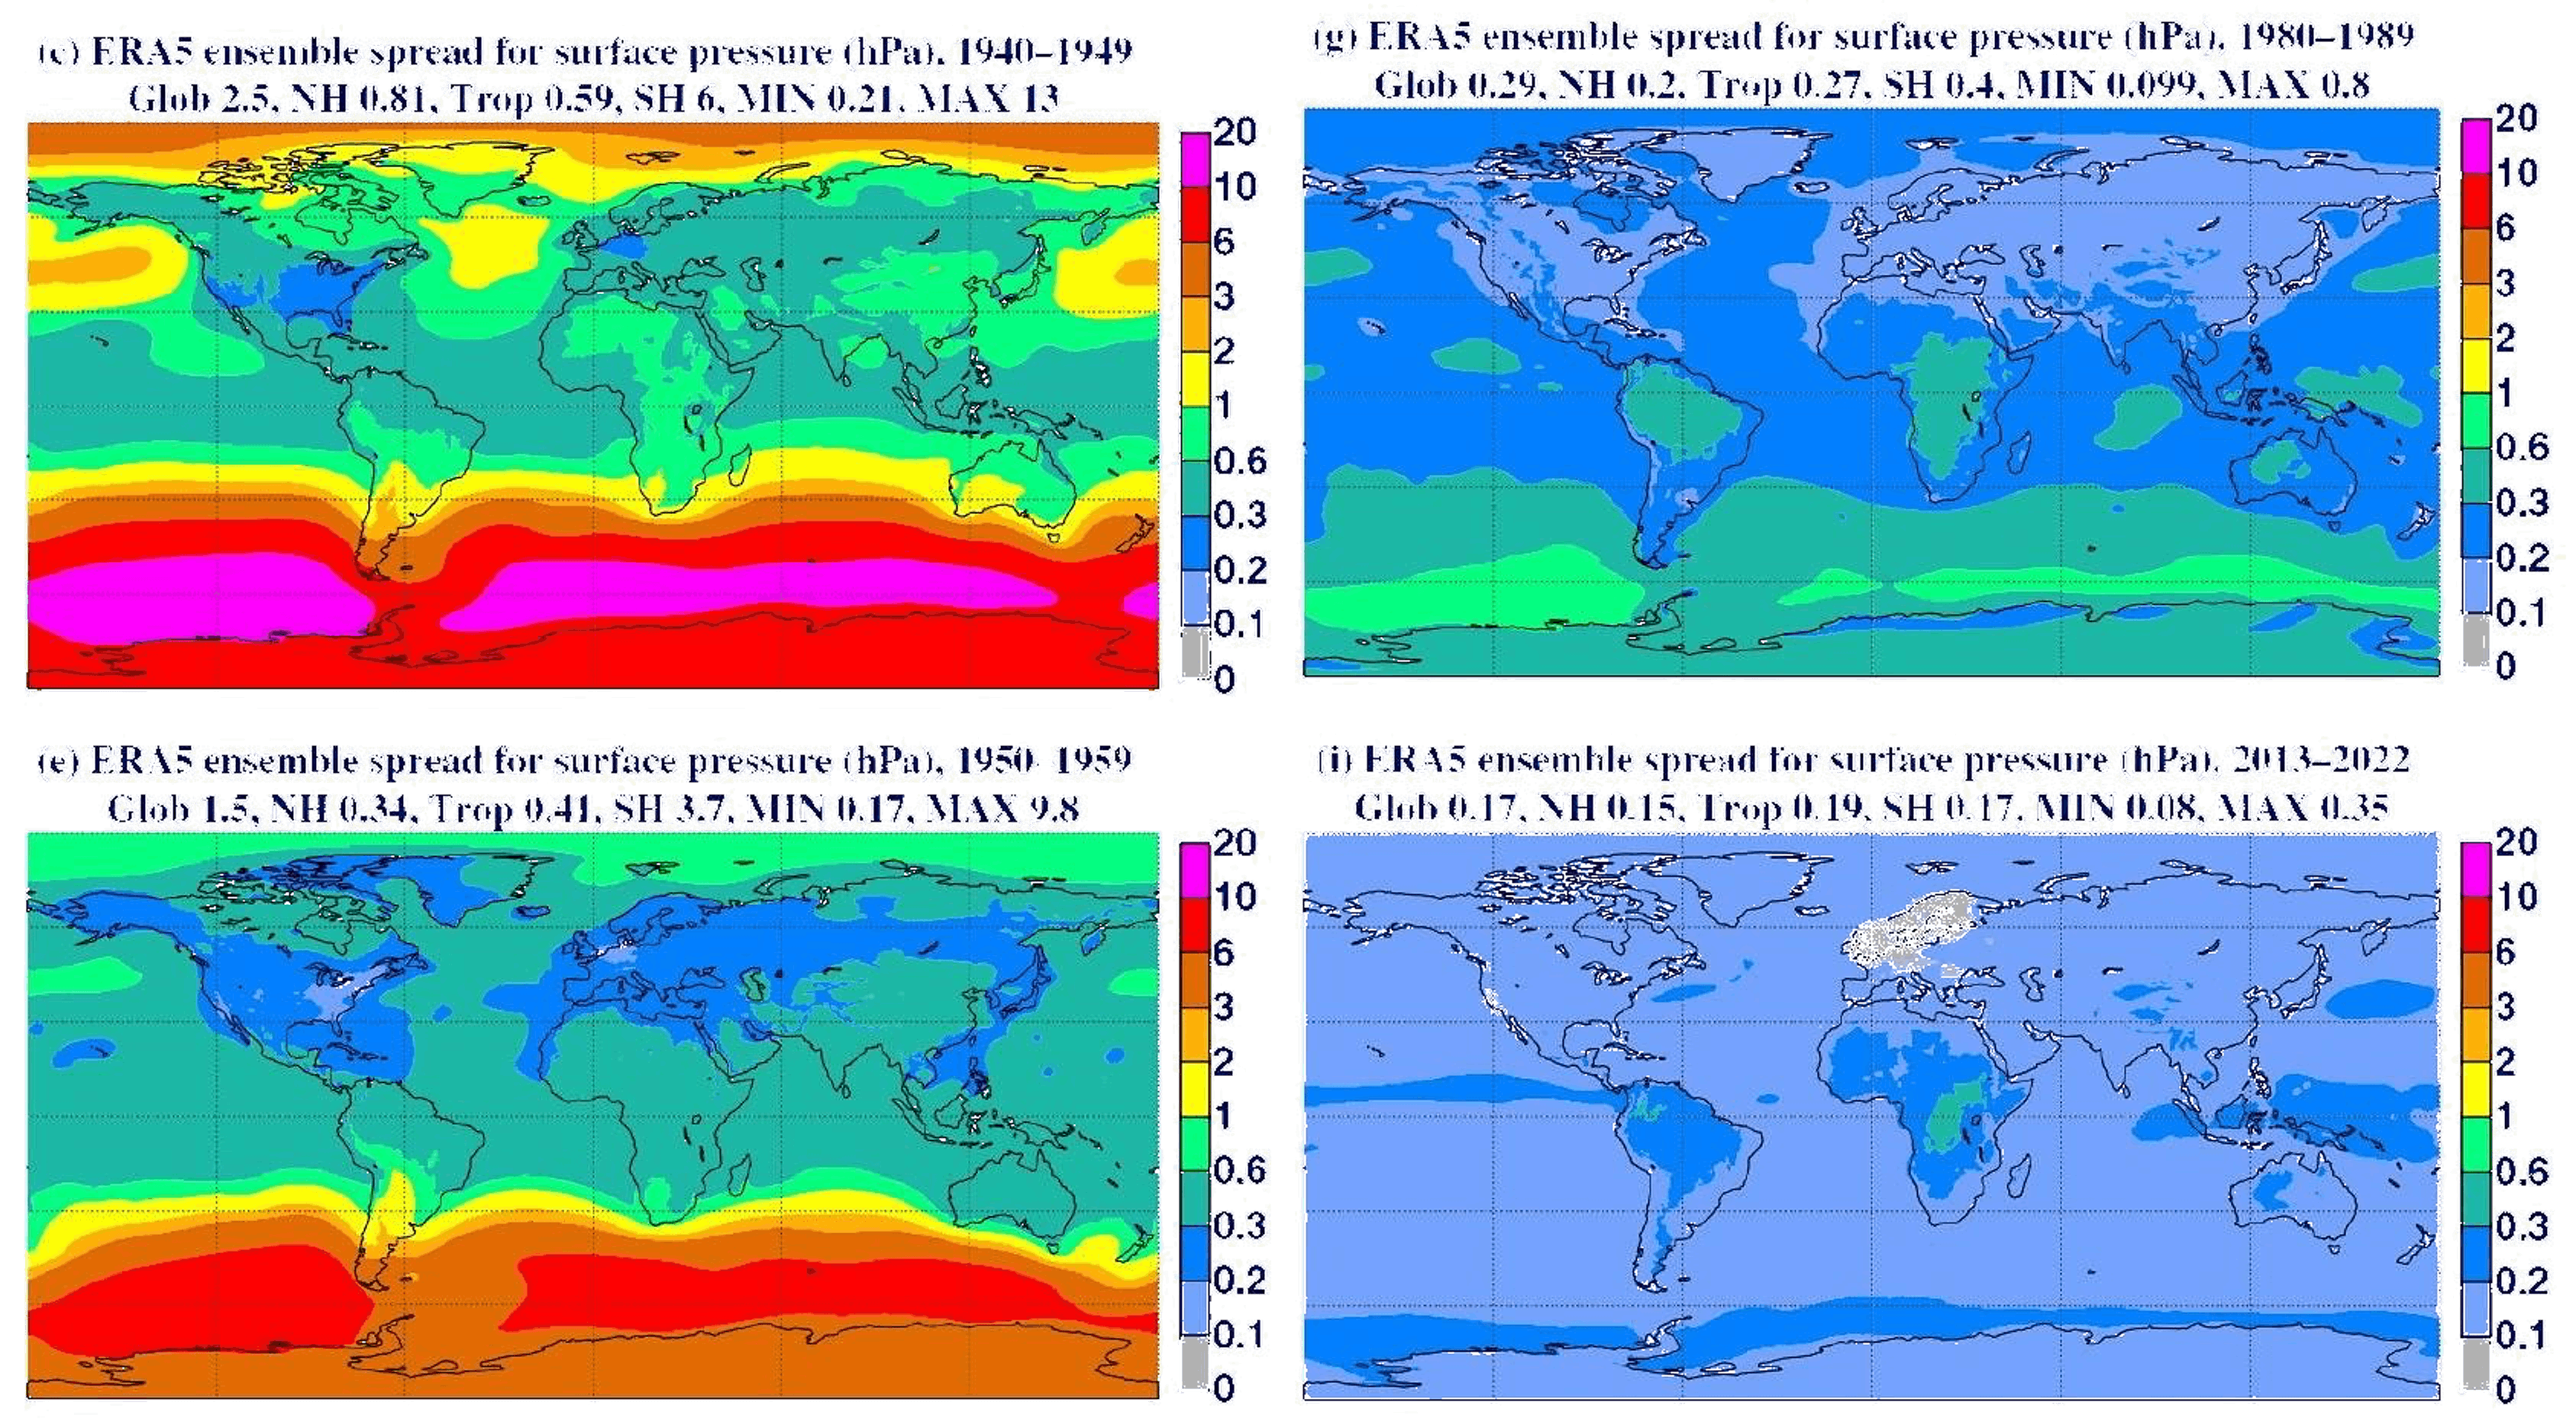
The physical component of the reanalysis used to produce this data set is entirely deterministic, relying on the same foundational base as numerical models like GFS or ECMWF. Because the best data available for this purpose are temporally limited to the extent described, (ERA5 produces data from 1940-present whereby the 1940s-1980s is presatellite) it is unsurprising that climate modeling for the sake of longer-term prediction is a challenging undertaking. This difficulty is most pronounced when utilizing AI/ML-driven models to make long-term predictions as they are heavily dependent upon the data they are trained on.
The venture-relevant takeaway is that an adequate treatment of this time horizon, under the umbrella sector of climate-risk intelligence, necessitates a large number of ensemble members to include a sufficiently well-resolved representation of extreme events. The model archetype alone, at the end of the day, does not create commercial value unless uncertainty is properly translated into decisions. A differentiated product will treat this time-scale as a high-resolution probability distribution with explicit attention to large deviations, all while conveying a clear message that an informed decision must rest upon a full probabilistic picture. This forecasting regime, albeit particularly challenging to accurately model, is precisely the place in which a climate-risk intelligence product can most definitively differentiate itself from the others on the back-end.
6.3 Modeling Stack
Across forecasting regimes, most climate-risk intelligence products can be understood as variations on a common modeling stack. The stack begins with the representation of a physical hazard and ends, if successful, with a decision-relevant output. The relevant layers are hazard modeling, exposure mapping, vulnerability modeling, and loss translation.
The first layer is hazard modeling: the representation of the physical event or hazard distribution itself. Depending on the product, this may involve numerical weather prediction outputs, climate-model ensembles, reanalysis products, catastrophe models, hydrological models, fire-weather indices, satellite observations, or AI/ML-based forecasts. This layer answers the physical question of what may occur, where, with what degree of intensity, and over what time horizon.
The second layer is exposure mapping. A hazard is only commercially relevant once it is mapped onto an entity that can be damaged, interrupted, repriced, insured, or adapted. This requires geospatial asset data. Namely, property locations, infrastructure networks, facility footprints, supplier nodes, insured exposures, or portfolio holdings are examples. At this layer, the product translates a physical observable into an exposure quantification.
The third layer is vulnerability modeling. Exposure alone does not determine loss. Two assets may experience the same hazard intensity but exhibit a different manifested response because of things like construction quality or operational redundancy. This layer therefore attempts to estimate how a given asset or operation responds when conditioned upon hazard exposure.
The final layer is loss and decision translation. A climate-risk intelligence product must eventually convert physical vulnerability into an economic or operational consequence. Said consequences might include expected loss, downtime, insurance cost, probability of default, asset impairment, resilience CapEx, or avoided loss. This layer is arguably the most important one, given that it is the closest feeder into the front-end part of a climate-risk intelligence product. Differentiation is likely most pronounced in this part of the model stack.
6.4 Uncertainty, Validation, and Decision-Grade Outputs
The uncertainty and validation components of the technical architecture constitute the primary back-end mechanisms that make a product output trustworthy enough to act on. Furthermore, a product’s architecture is holistically incomplete unless the final output is tied to an intelligible decision.
The duly described modeling stack is only useful if uncertainty is carried throughout the assembly line as opposed to being hidden or absorbed in a deterministic score too early. Uncertainty is necessarily quantifiable at each step of the translation process such that a well-constructed decisions-grade report as a final output must detail both the manner in which uncertainty arises and how it evolves or interacts with other sources. This is not a trivial endeavor, as one with a probabilistic acumen might expect that the quantification of uncertainty evolves as a potentially nonstationary process in which error, ostensibly measured by naive second moment tests, may change in magnitude or drift. The treatment of this quantity, with great care, will ensure an optimal output diagnostic and determine the most rigorous manner in which a product can develop a competitive edge.
Validation is correspondingly uneven across time horizons. Short-term forecasts can be evaluated against realized events with relatively frequent feedback, while long-horizon climate-risk products must rely more heavily on hindcasts and reconciliation with the primitive evolution equations for physical consistency. In the pursuit of the latter’s validation, a reliance upon a sufficiently large ensemble size is paramount. A product’s credibility depends on whether it can explain what has been validated, over what horizon, for which hazard, and against which outcome. Ergo, the output needs to be convincing through its presentation as something feasibly tangential to past occurrences in the available data.
For the sake of elaborating upon decisions-grade outputs, it should be noted that a buyer rarely needs a probability distribution of some individual event for its own sake. The consumer is far more interested in whether uncertainty is large enough, directional enough, and financially material enough to change an action. In this sense, the product’s technical aptitude is measured by whether uncertainty is made legible enough to support substantive changes entailing investments like resilience CapEx or operational adjustment. Indeed, the front-end component is arguably the most important.
6.5 Architectural Archetypes
The aforementioned modeling stack should not be interpreted as implying that all companies in the sector place equal emphasis on each layer. In practice, climate-risk intelligence products possess a center of architectural gravity. Some are weighted toward physical hazard modeling, others toward exposure mapping, others toward loss translation, and still others toward the final workflow in which the customer is meant to act. This distinction is useful because two companies may both describe themselves as climate-risk analytics platforms while, in reality, solving very different problems.
One archetype is the climate-model-forward platform. These products place the most weight upon long-timescale physical-risk analytics. Their center of gravity lies in hazard modeling, downscaling, scenario analysis, and asset-level exposure assessment. Companies such as Jupiter Intelligence, Climate X, First Street, and XDI are closest to this archetype, as they are generally concerned with translating future flood, fire, heat, wind, or other hazards into property-level or portfolio-level risk intelligence [2]. It follows to recognize that this architecture’s strength lies within tackling the innately challenging endeavor of rendering long-term physical risk as an intelligible course of action for resilience prior to realizing any losses. However, its strength overlaps with its weakness as the modeling used to create said outputs is still far from perfect and remains difficult to validate. The product can also devolve into a static exposure map if the loss and decision layers are underdeveloped.
A second archetype is the weather-intelligence platform. These products are weighted toward short-term or sub-seasonal hazard forecasting rather than multi-decade climate projection. Tomorrow.io, Salient Predictions, and EHAB are some of the more renowned examples of this category. Tomorrow.io focuses on real-time and hyper-local weather intelligence, Salient emphasizes the two- to fifty-two-week forecast horizon, and EHAB applies weather-risk analytics to construction and operationally intensive industries [2]. The strength of this architecture is immediacy. Namely, its outputs can be tested against an abundance realized conditions and mapped into near-term operational decisions. What limits this is that the product may be less useful for asset valuation, capital planning, or long-term adaptation unless the near-term forecast layer is connected to a broader risk and resilience framework (which is not always simple to do).
A third archetype is the insurance- and catastrophe-risk platform. These products place disproportionate weight on vulnerability modeling, loss translation, and risk transfer. FloodFlash, Understory, Demex, and Kettle are relevant examples, since their products are oriented around parametric flood insurance, hail risk, severe convective storms, and wildfire risk [2]. In this architecture, the hazard model is only valuable insofar as it can be converted into a premium, expected loss, or reinsurance decision. To discuss strengths and weaknesses as they pertain to forecasting horizons would be superfluous, as it largely depends upon the types of insurers being serviced. The relevant technical question is therefore whether a physical hazard event’s representation is good enough to support pricing and claims logic.
A fourth archetype is the asset- and infrastructure-intelligence platform. These products are weighted toward exposure mapping, monitoring, and operational situational awareness. Companies such as AiDash, Gridware, LiveEO, and related infrastructure-monitoring platforms sit near this boundary, using satellites, sensors, or other data streams to characterize the state of physical assets [2]. Not all of these companies fall cleanly within climate-risk intelligence as defined in this memo, since the primary value in some cases may lie in monitoring or hardware-adjacent asset management. They become relevant to the sector when the monitoring layer is translated into forward-looking risk, avoided loss, or adaptation planning.
A fifth archetype is the workflow-forward planning platform. These products are weighted less toward the novelty of the physical model and more toward embedding climate-risk outputs into a buyer’s existing decision process. Rhizome, Unwritten, and ClimateView illustrate this tendency across utilities, finance, and local-government planning [2]. The architectural bet is that the scarce commodity is goes beyond mere hazard information, further opting to incorporate a tractable means of turning such information into budgeted action. In this sense, the workflowforward archetype is closest to the commercial endpoint of the stack-i.e. the decision itself.
These archetypes are not mutually exclusive. The best companies are likely to straddle, and thus combine, several of them. A climate-model-forward company may need a workflow-forward interface; a weather-intelligence company may need sector-specific vulnerability functions; an insurance-risk company may need proprietary hazard and exposure data. The purpose of the taxonomy is therefore to identify where each product’s center of gravity lies, all while allowing for tendrils of said product to seep through the permeable membranes weakly separating these archetypes. This is important because the locus of technical risk, commercial defensibility, and customer value changes depending on which layer of the stack a company chooses to make its forte.
7 What Actually Differentiates Products
In 1975, renowned applied mathematician Benoit Mandelbrot first rigorously defined the fractal [22]. For the sake of brevity, this memo will forego any description of said mathematical definition and simply provide a graphic for the visual learner engaged with this document.

The important behavior of the fractal is its self-similarity as one zooms in on the geometric object. Of course, the mathematical formalism allows this notion to be extrapolated to things like time series or, more broadly, data sets. The relevance, and, by extension, the prescience, of this recollection of Mandelbrot’s most famous work will become more clear as this section progresses. Of principal importance is that the notion of fractality is ubiquitous in the non-linear behaviors underlying nature and the physical environments existing within it. Indeed, the statistics we generate by the data we collect from nature are no exception to this.
7.1 En Pratique
In the description of technical differentiating factors, this memo will start by elaborating upon the mechanistic structure of the back-end component. The weakly-separated taxonomy applied to technical archetypes will be treated with agnosticism here, as the degree to which a particular product engages with some part of the back-end component bears little weight upon how the back-end component ought to behave, in broad strokes.
7.1.1 Modeling
The first point of non-trivial work that a product must perform is the act of translating the omnipresent possibility of physical hazards into an identifiable local exposure. In other words, for a given location, a product must aggregate data, perform some sort of predictive analysis, and then identify the raw numbers on the gridded location of interest. The freedom in the manner of approach to this step is vast as it pertains to one’s choice. For a given forecasting regime, a product decides whether it wants to rely upon numerical weather prediction models, AI, ML, or some hybrid blend of the aforementioned options. Then comes the decision of whether one assumes ergodicity of the local system in terms of the manner in which the physical hazards are modeled. Deviations from the mean background state for subseasonal to seasonal time-scales might be sufficiently ergodic to furnish the use of a simple stochastic model for the sake of producing some distributional spread of risk exposure. However, the same may not be appropriate when considering a different time horizon in which a cyclic background state, upon which deviations might be studied, does not prevail as a dominant mode. Thus, an accurate treatment would likely rely upon a large ensemble to ameliorate the inability to effectively perform a Reynolds decomposition upon the vector or scalar quantities underlying the main dynamics.
A suitably heuristic statement describing the differentiating factor takeaway would say something along the lines of a product admitting a competitive advantage, in the modeling component, by employing a flexible modeling treatment depending on the forecasting regime desired by the customer. But such a statement does not fully explicate the manner in which that is done. To mend this gap, it follows to entertain a bit of first principles. The statistical ensemble originates from the field of statistical mechanics, courtesy of the great Josiah Willard Gibbs. The notion
itself is most axiomatically defined as a collection of identical theoretical copies of a physical system such that a notion of non-temporal statistical moments can be defined. A single, isolated system that sees its state evolve in time can make no claims of spatial averages without relying upon a particular trajectory’s temporal evolution. Without a notion of ergodicity (where temporal averages converge to spatial ones), the spatial average is inaccessible. Thus, the notion of the ensemble creates a theoretical means by which to make spatial averages intelligible. It allows one to determine the likelihood of a particular region of a physical system being a certain way at a specified time. This framework is immensely powerful and serves as the backbone for defining important concepts in thermodynamics. This is all to say that the instinct software providers may have to form large ensembles of model runs for the sake of risk management is based in rigorous mathematical physics. The minimum necessary to furnish an argument for a product’s differentiating factor in the modeling component is that said product utilizes the notion of an ensemble where necessary and with an understanding of its origin.
Recent advances in AI/ML-driven weather modeling should therefore be understood as an expansion of the available model class rather than a totalizing replacement of numerical weather prediction. GraphCast and Pangu-Weather demonstrated that learned models trained on reanalysis data can achieve striking medium-range forecast skill at far lower inference cost than traditional numerical systems [16, 3]. GenCast extends this development into probabilistic forecasting by producing stochastic global ensembles over fifteen-day horizons, while Aurora illustrates the possibility of a foundation-model approach spanning several Earth-system prediction tasks [29, 4]. The commercial relevance of this shift is quite potent. If forecasts can be produced more cheaply, more frequently, and with a larger family of ensemble members, then the marginal cost of localized risk intelligence falls. However, the mere invocation of AI is not a sufficient differentiator. A model that is fast and smooth is still inadequate if it fails precisely where the customer’s loss function is most convex.
The more interesting question is architectural fitness. Numerical weather prediction carries the advantage of explicit physical structure, as its dynamical core is anchored in discretized equations of motion and physical parameterizations. AI/ML models carry the advantage of statistical expressivity, as they can learn high-dimensional mappings from large historical archives with great computational efficiency. Hybrid models attempt to occupy the interstitial region between these two modes of thought. NeuralGCM is particularly instructive here because it combines a differentiable dynamical core with learned components, thereby retaining a physically meaningful scaffold while allowing the model to learn unresolved tendencies from data [15]. For diligence purposes, the important question is whether the model architecture is suited to the hazard, time horizon, and decision being served.
This distinction becomes most severe in the distributional tails. Climate-risk intelligence is purchased because floods exceed design standards, heat waves distort labor productivity, and wildfires turn insured assets into discontinuous loss events. Benchmarking efforts like WeatherBench 2 are useful because they place physics-based and data-driven models into a common evaluative frame [30]. However, a product meant to inform underwriting or asset valuation cannot be judged only by aggregate forecast skill or simple first moment statistical diagnostics. Recent work on record-breaking events suggests that several AI weather models still underestimate the frequency and intensity of extreme heat, cold, and wind events relative to numerical benchmarks [43]. Therefore, it should be noted that the rare event is generally the event for which the product is purchased.
Thus, a climate-risk intelligence company differentiates itself in the modeling layer when it exhibits disciplined selectivity. Short-term operational products may require fast probabilistic forecasts and strong local calibration. Sub-seasonal products may require anomaly forecasts conditioned upon slowly varying boundary states. Longhorizon asset-risk products may require scenario-conditioned ensembles and a defensible treatment of nonstationary extremes. The model class itself is consequently less important than the model’s relationship to the use case. A product with genuine technical merit treats physical uncertainty as a first-order object in the architecture, rather than as an aesthetic inconvenience to be compressed into a clean dashboard.
7.1.2 Data and Probabilistic Analysis
The field of probability theory is broad enough that upon telling someone that this is one’s specialty, that someone, if quantitatively inclined themselves, will almost surely ask for a more specific subset. It is akin to saying “I study thermodynamics” or “I study economics.” Thus, the structure of a product’s probabilistic analysis of both observational and model data can vary wildly from customer to customer.
Those aiming to describe an atmospheric state, and by extension a physical hazard, will generally gather data readings for both scalar and vector quantities like wind velocities, temperature anomalies, or even precipitation amounts. Data produced by observational measurements or from spatially-resolving models are usually delivered to the analyst in the form of a grid with a dimension \(>1\). There are often multiple spatial dimensions as well as a temporal one,
thus making the first stage of analysis one in which a crossroads must be addressed. The analyst has the choice of either making physically appropriate assumptions to furnish the argument for averaging along spatial coordinates to reduce the data set’s dimensionality, or performing analysis directly on the higher-dimensional data set. The former is most sensible for the sake of producing more digestible statistical metrics like temporal means or variances. However, the latter often requires slightly more clever methods of analysis. A standard one among the community of Earth and climate scientists is the use of empirical orthogonal function (EOF) analysis, otherwise referred to as principal component (PC) analysis. This breaks down higher-dimensional data by reproducing the modes of variability responsible for the temporal variance along spatial dimensions, thereby picking out the quasi-periodic modes most responsible for the most pronounced oscillations about the scalar mean state. A product can differentiate itself in the data analytics component by employing a sophisticated analysis of both spatial and temporal variabilities on non-dimensionally-reduced data prior to computing moment-based statistical diagnostics that tend to wrap up, and often hide, important oscillations.
Despite indication that the naive computation of the classic mean and variance quantities of time series data is a cavalier undertaking, it remains an unavoidable aspect of a complete probabilistic analysis of aggregated data. In the wake of a proper EOF- or PC-style analysis of unadulterated data sets, it certainly follows to use what has been gathered from said analysis to compute moment-based statistical measures, permitting further analysis of distributions and their tail behaviors. Of course, the signals produced by nature and its model surrogates are often quite irregular. Many of them exhibit non-Gaussian statistics, despite a large sample size, seemingly circumventing the central limit theorem’s effects altogether. Indeed it is frequently the case that statistics derived from the gathered data exhibit multifractal behavior, whereby different moments of the signal exhibit anomalous distributional behavior. Something like a multifractal detrended fluctuation analysis (MFDFA) generalizes the typical first and second moment computations to positive and negative integer moments of size \(q \in \mathbb{Z}\). MFDFA, and the like, attributes a sense of universality to behaviors observed as a dependence upon a spectrum of said moments \(q\), allowing one to observe how variability, extremes, and persistence change across time scales in the most general manner possible. Namely, MFDFA involves computing a generalized Hurst exponent, \(H(q)\), through which one can determine whether bad conditions have a tendency to cluster (i.e., persistence). In climate-risk terms, this matters because risk is worse when hazards cluster: multi-week heat, multi-season drought, repeated heavy-rain events, and so on. MFDFA also permits a metrizable understanding of the data’s intermittency; in climate-risk terms, this might look like a quantification of long quiet periods interrupted by bursts of intense activity. Evidently, the process of MFDFA unveils a means by which to enforce a taxonomy via prescribing universality classes to scale-dependent behaviors of data, thereby adding a generalized moment and thermodynamic description of observed signals. MFDFA need not be the exact method utilized to explicate the anomalous scale-dependent behaviors of the data aggregated or the model projection results produced thereof. However, a key trait that one ought to consider when seeking a differentiating aspect within the probabilistic and data analysis component of a product’s back-end is the careful treatment and inclusion of the non-trivial effects that anomalous singular scaling may proliferate throughout the logic chain.
7.1.3 Decisions-Grade Output Translation and Presentation
The final differentiating factor is the one most visible to the customer and, paradoxically, the one most dependent upon everything hidden behind the interface. A climate-risk intelligence product can be impressively modeled and carefully calibrated while still failing commercially if its outputs do not correspond to the customer’s actual decision space. The purpose of the front-end component is therefore to translate the back-end’s probabilistic machinery into a form that can alter underwriting, lending, asset management, or operational planning. This is why TCFD’s description of climate-related disclosures as decision-useful and forward-looking is relevant even outside the narrow context of reporting [33]. The product must help the buyer decide what ought to be done before the loss has already materialized.
Decision-grade output begins with the proper identification of the decision-maker’s loss function. An insurer needs to know whether the exposure changes price adequacy, policy limits, or reinsurance strategy. A lender needs to understand whether a borrower’s collateral, cash flow, or default risk has changed. An asset owner is asking whether to acquire, harden, or sell. In each such case, the same physical hazard may be translated into a different monetary object, and thus a product differentiates itself when it understands this plurality of end states.
The technical act of output translation consequently resembles a change of coordinates. The native coordinates of the model may be flood depth, fire weather index, or wind speed, whereas the native coordinates of the customer are expected loss, downtime, insurance cost, or CapEx. The product’s work is to define a credible map between said coordinate systems. It must carry units, assumptions, uncertainty bounds, and an explanation of what would cause the estimate to change. Otherwise, the customer is left with a polished score whose precision is more decorative than informative.
The real estate literature is particularly instructive because the asset-level decision process is rather concrete. ULI and LaSalle’s 2022 work emphasizes the importance of choosing providers whose climate-risk analytics align with business needs and can be integrated into real-estate life-cycle decisions [37]. Their later underwriting report pushes the point further by showing how physical-risk analytics can enter acquisition diligence, underwriting assumptions, and disposition strategy [38]. This is the standard to which products should be held. The output should change a model input, an investment committee memo, or a resilience plan; when it changes none of these, the product is effectively relegated to environmental ornamentation rather than the infinitely more desirable decision infrastructure.
The OSFI/AMF standardized climate scenario exercise frames credible physical-risk assessment around geospatial data, hazard models, and loss estimates that can be incorporated into financial-risk analysis [28]. This indicates what the output layer must eventually accomplish for banks and lenders. Physical hazard information must be translated into credit exposure, collateral impairment, or portfolio stress. The difficulty is heightened by the fact that scenario tools are often global in design while lending and underwriting decisions are local in consequence. NGFS accordingly warns that long-term climate scenario results should be used with care at granular levels [25]. A differentiated product will therefore explain when its outputs are local enough to support a site-level decision and when they are merely directional enough to support portfolio screening.
Presentation is not something that can be brute-forced by technical acumen, as it is a matter of taste. Taste comes from maturity and an appreciation for the appropriate aesthetics, which is a talent in and of itself. Ergo, the manner in which all of the above is framed and showcased is far from a superficial pursuit. The interface determines whether uncertainty is seen as a tractable input or ignored as an inconvenience. A strong product should allow the customer to move between a portfolio view and an asset view without losing the logic of the calculation. It should display the baseline, the scenario-conditioned change, and the recommended action. It should also expose enough of the model’s assumptions to make the output auditable. Obviously, this does not require the customer to become a climate scientist. It does, however, require the product to show the customer where the confidence is high, where the tails dominate, and where human judgment must prevail.
This final layer is also where product taste becomes commercially material. Some buyers want an exceedance curve, some want a credit-risk adjustment, while others want a prioritized list of assets for resilience CapEx. The best products will not force every customer into the same universal risk score. They will translate the same physical substrate into the grammar of the buyer’s workflow. This would likely involve a customized product, within reason, tailored to individual customers. Furthermore, the most defensible companies will be those whose outputs can travel from the model to the meeting room without losing their probabilistic integrity, all while being a unique servicing of the customer’s unique needs.
8 Business Models
The business model of a climate-risk intelligence company should be understood as the commercial shadow cast by its technical architecture. If the back-end converts physical hazards into probabilistic estimates of exposure, vulnerability, and loss, then the front-end must convert those estimates into a willingness to pay. Revenue is most naturally extracted at the point where uncertainty becomes budgetary. A customer pays when the output changes underwriting, lending, asset management, resilience CapEx, or operational planning. Thus, the most attractive business models are those attached to recurring workflows as a seamless end-to-end layer.
8.1 Software and Enterprise Licensing
The most straightforward model is enterprise software. In this form, the company sells access to a platform that allows customers to upload assets, select hazards, run scenarios, and receive risk outputs. Pricing can be organized by seat, portfolio size, geography, hazard module, or analytical depth. The virtue of this model is its familiarity to enterprise buyers, whereas the drawback is that the product must earn renewal through workflow integration. A climate-risk dashboard that is consulted once a year for disclosure purposes will struggle to command the same budgetary gravity as a platform inextricably embedded into underwriting, credit review, or capital planning.
Companies closest to this model are those selling asset-level and portfolio-level analytics to financial institutions, real estate investors, infrastructure owners, and corporates. First Street’s Enterprise Suite, for example, is described as allowing financial institutions, asset owners, and companies to upload property portfolios and evaluate exposure, damage, downtime, and correlated portfolio risk over thirty-year horizons [9]. This is the basic form of a venturescale software motion in the sector. Namely, it starts with risk visibility, then migrates toward recurring analytical dependence.
8.2 Data, API, and Embedded Distribution
A different sort of business model monetizes the data layer more directly than the others discussed. Here, the product is sold through APIs, licensed datasets, raster layers, or embedded feeds. This sort of model is attractive when the customer already possesses a workflow and does not need a separate interface. Mortgage platforms, real estate marketplaces, insurance systems, and financial-data terminals are all natural distribution surfaces, whereby the company earns its place by becoming part of another system’s informational substrate.
First Street’s API offering is illustrative because it separates climate-risk data for any point on Earth, enterprise portfolio aggregation, and raster map layers into distinct access routes [7]. ClimateCheck’s partnership with Black Knight is another useful example. Here, climate-risk information is incorporated into a mortgage-data platform already used by lenders, servicers, and investors [12]. The customer need not be buying “climate software” as a standalone object; rather, the customer is buying a workflow that now happens to contain climate intelligence. It is a business model with a quieter commercial elegance, if you will, inserted tactfully with flavors of climate intelligence.
8.3 Risk Transfer and Insurance-Linked Models
A third model is manifested as climate-risk intelligence fused with the movement of risk itself. In this case, the product goes beyond advising the customer about exposure. Namely, it helps price, structure, or trigger a risk-transfer instrument. Parametric insurance is the cleanest example. FloodFlash, for instance, pays out when a pre-agreed flood-depth trigger is met [10]. The analytical layer is therefore inseparable from the contractual one: the model informs the trigger, the trigger defines the payout, and the payout becomes the customer-facing value proposition.
Demex offers a related architecture on the reinsurance side, describing itself as a technology-enabled service provider that builds models for secondary weather perils and structures climate risk-transfer products with insurers, reinsurers, and brokers [6]. This type of business model can be powerful because monetization is linked to financial risk rather than software usage alone. Its difficulty is that underwriting discipline becomes existential. A weak model is easily capable of incorrectly pricing the risk-bearing instrument itself.
8.4 Advisory-Led and Services-Augmented Models
A fourth, and for these purposes, final, model uses advisory work as either a wedge or an unavoidable companion to software. This is especially common in markets where the buyer lacks the internal competence to interpret climaterisk outputs. ULI and LaSalle’s work on climate-risk analytics emphasizes the need to select providers aligned with business needs, evaluate the science underpinning the products, and integrate the outputs into real-estate life-cycle decisions [37]. That set of tasks is rarely solved by software alone, especially in the early stages of category formation.
Services are not inherently disqualifying, as they may create trust, improve data ingestion, and teach the company which workflows deserve to become “productized”. The venture concern arises when services remain the product rather than the bridge to one. A company selling bespoke climate reports is closer to consulting, whereas a company that uses early advisory engagements to codify repeatable workflows may be building software with unusually informed customer knowledge. This delineating factor is key.
8.5 Venture Interpretation
The strongest business models in this sector will likely combine software recurrence with workflow inevitability. A company may begin with exposure scores, but it must eventually sit inside a decision that repeats. Insurance renews, loans are originated, assets are acquired, infrastructure budgets are allocated, and operations are disrupted and then planned again. These recurring moments are where climate-risk intelligence can become something more substantive than a tangential supplement: it can achieve the status of core infrastructure.
In this sense, business-model quality is a continuation of technical quality. A product that translates physical uncertainty into a decision can monetize that decision. A product that stops at hazard visualization must monetize attention. Venture-scale outcomes are far more likely in the former case.
9 Competitive Landscape
The competitive landscape for climate-risk intelligence is best understood by determining where any given company situates its center of mass along the translation chain. Some firms compete through the depth of their physical hazard models while others compete through asset-level exposure data, vulnerability functions, or the ability to translate
physical risk into a financial decision. The category is therefore a series of partially overlapping contests over who controls the most decision-relevant layer of the stack.
A weak company in this sector sells a bijective map. A more serious company sells a model. A stronger company sells a model whose uncertainty is usable inside an existing workflow. And, thus, the most defensible company sells a recurring decision layer. When it comes to competitive edges, the matter of principality is whether a company can make climate risk difficult for the buyer to ignore.
9.1 Climate-Risk Financial Modeling Platforms
The first competitive cluster consists of companies attempting to become the analytical layer for asset-level and portfolio-level physical climate risk. First Street, Jupiter Intelligence, Climate X, and XDI sit closest to this center of mass. Their shared ambition is to translate physical hazards into financial or operational consequence for real estate, infrastructure, financial institutions, and large asset owners [2]. The moat in this cluster is built from four ingredients: hazard science, geospatial coverage, vulnerability translation, and institutional trust.
First Street is a particularly instructive case because it has moved from property-level climate-risk communication toward what it calls climate-risk financial modeling. Its API documentation describes separate access routes for point-level climate-risk data, portfolio-level aggregation, and raster map layers [7]. Its 2026 expansion beyond real estate into companies and complex infrastructure explicitly connects physical exposure to earnings, credit, and valuation [8]. This is a meaningful strategic migration, as the company has graduated from merely exposing the hidden risk of an address to a state of attempting to define a common analytical grammar by which physical climate risk enters institutional finance.
The First Street moat is somewhat of a linear combination of scientific acumen and distributional servicing. Its models are presented as transparent and peer-reviewed, while its consumer-facing presence has helped normalize the idea that climate risk should be legible at the property level. The Zillow partnership, which brought First Street risk data into residential listings, illustrates the power of distribution as a moat [44]. It also illustrates the fragility of this kind of moat. Once risk scores enter markets where property value is immediately at stake, model trust becomes a social and political problem in concert with being a scientific one. A company in this position must then defend the legitimacy of making the physics visible in addition to the physics itself.
Jupiter Intelligence occupies a more enterprise-forward version of the same terrain. Its public materials emphasize portfolio and asset-level physical-risk analysis, stress testing, financial translation, and auditable methods capable of supporting regulatory review [13]. This suggests a moat built around institutional negotiation and acceptability. For banks, insurers, asset managers, and infrastructure owners, the product must survive model-risk review and investment committee scrutiny. Jupiter’s competitive position therefore rests upon the ability to make climate analytics look like a defensible input into risk governance.
Climate X similarly competes through asset-level and portfolio-level financial translation. Spectra is described as a platform for physical climate-risk analysis that helps financial institutions integrate risk assessments into diligence, originations, stress testing, and client engagement [5]. The company also describes its approach as combining downscaled multi-model climate projections with proprietary vulnerability datasets and geospatial hazard models. This is precisely where product differentiation can become nontrivial, as the hazard field itself may be derived from broadly available scientific infrastructure, but the vulnerability layer determines whether the same hazard becomes a tolerable nuisance or a material impairment.
XDI represents a slightly older and more infrastructure-native archetype. It describes its work as quantifying the cost of extreme weather and climate change impacts to physical assets across more than 175 countries [41]. Its language is particularly aligned with the core translation problem of this memo: risk to resilience, exposure to cost, hazard to adaptation. The moat here is time, accumulated methodology, and physical-asset specificity. XDI’s claim that outputs are traceable to points of failure within individual assets is important because traceability is often what separates an institutional-grade risk product from an effectively cosmetic score.
The central competitive tension in this cluster concerns the relationship between breadth and depth. Indeed, broad platforms can cover more hazards, geographies, and asset classes. Deep platforms can produce more credible analysis for a narrower problem. The venture-scale winner need not be the company with the largest hazard menu. It will be the company whose outputs are trusted at the moment when capital is actually allocated.
9.2 Weather Intelligence and Operational Adaptation
A second competitive cluster is weighted toward near-term and subseasonal decision-making. Tomorrow.io and Salient Predictions are useful representatives. They do not compete primarily through multi-decade asset impairment analytics. Their value proposition emerges from making weather and climate variability actionable before an operational loss is realized.
Tomorrow.io describes itself as a weather intelligence and resilience platform whose observations and models help organizations monitor, predict, and respond to escalating threats [35]. Its competitive advantage is therefore plausibly rooted in proprietary observations, operational integrations, and the frequency with which customers consult the product. A platform used to manage aviation delays, logistics disruption, heat risk, or emergency response has a different rhythm from a platform used for annual disclosure. The former can become operational muscle memory.
Salient Predictions occupies the more unorthodox subseasonal-to-seasonal space. It describes AI-powered weather forecasts spanning one day to one year, with claims of improved accuracy and a large number of machine-learning predictors [31]. This horizon is commercially interesting because decisions often must be made before ordinary weather forecasts become useful. Agriculture, energy procurement, water management, and supply planning all contain decisions whose lead times sit awkwardly between weather and climate. Salient’s moat, if realized, would emerge from skill in this intermediate regime. That moat is technically demanding, being that it demands analysis of perturbations to an ambient state, because subseasonal predictability is innately a probabilistic endeavor and a highly regional one at that.
The competitive question for this cluster is whether the product can define action thresholds. A better forecast is commercially insufficient until it elicits a change in what the customer does. The most prominently venture-scale weather-intelligence companies will therefore combine forecast skill with workflow specificity. They will know the difference between a forecast that is meteorologically impressive and a forecast that changes how a grid operator, airline, construction firm, or agricultural buyer behaves.
9.3 Insurance and Catastrophe-Risk Platforms
A third cluster is shaped by insurance and catastrophe analytics. ZestyAI, Kettle, FloodFlash, Demex, Moody’s RMS, and Verisk all sit within some \(\varepsilon\)-ball of the landscape’s origin, though with very different business models [2]. Within this cluster, it is imperative that the output survives pricing. A climate-risk model that informs underwriting must eventually confront claims, losses, regulators, and renewal cycles. This creates a harsher validation environment than that which generic climate dashboards encounter.
ZestyAI is a strong example of an insurance-facing climate and property-risk analytics company. Its public materials emphasize parcel-level risk insights for underwriting, pricing, inspection optimization, and coverage expansion [42]. Its claimed regulatory traction is especially important: ZestyAI states that its AI-driven models for wildfire, severe convective storms, and non-weather water damage have been approved in over 50 regulatory filings nationwide. For an insurance analytics company, regulatory acceptance is in and of itself a commercial moat. It lowers adoption friction for carriers and creates a form of institutional credibility that cannot be replicated by publishing a model demo.
Kettle represents a more risk-bearing version of the same logic. Its public materials describe three AI models for wildfire ignition, spread, and building vulnerability, trained or informed by large volumes of satellite, weather, real estate, and utility data [14]. This is a clean example of a company whose moat cannot be reduced to hazard prediction alone. Wildfire risk becomes commercially intelligible only when ignition probability, spread dynamics, and structural vulnerability are jointly mapped into underwriting. The company that bears or structures risk also receives a sharper feedback signal. If the model fails, the loss is financial rather than rhetorical.
Moody’s RMS and Verisk represent incumbent catastrophe-modeling gravity. Moody’s Climate on Demand API allows clients to model real assets or corporate facilities across hazards and retrieve financial-impact metrics such as annualized damage rates and damage volatility [23]. Verisk’s catastrophe-risk solutions similarly reflect the incumbent advantage of insurance-market distribution and catastrophe-modeling familiarity [39]. These firms possess durable moats in trust and, by extension, buyer inertia. Startups must therefore avoid competing against them on generic catastrophe analytics alone. They must either be materially better for a specific peril, materially faster in productization, or materially more usable in a neglected workflow.
9.4 Infrastructure, Asset Monitoring, and Operational Resilience
A fourth cluster sits near the boundary of this memo’s definition. Companies such as AiDash, LiveEO, Gridware, and Rhizome are often discussed in climate adaptation and resilience market maps, but their relationship to climate-risk intelligence depends upon where the primary value resides [2]. If the product is mainly a monitoring tool, hardwareadjacent asset-management platform, or field-operations system, it may fall outside the aforementioned definition used here. If the product translates monitored asset conditions into forward-looking physical risk and adaptation planning, it becomes relevant.
The moat in this cluster is operational intimacy. A utility does not merely need to know that wildfire risk is rising in a region. It needs to know which line segment, vegetation corridor, transformer, or crew schedule deserves attention. An infrastructure investor needs to know which part of an asset system creates the failure pathway. Products in this cluster compete by acquiring asset-specific data that horizontal climate platforms often lack. Their defensibility comes from becoming embedded in the customer’s physical operating system, as always, in an inextricable manner.
This cluster also shows why the border between climate-risk intelligence and climate adaptation technology is akin to a porous membrane. A sensor company, satellite analytics company, or grid resilience platform can become a climate-risk intelligence company if its output changes a forecast, a vulnerability estimate, or a resilience investment. The venture-relevant distinction is the degree to which the product moves from observation to decision. Monitoring reveals state, but intelligence alters action.
9.5 Incumbent Financial-Data and Advisory Platforms
The final competitive cluster consists of incumbents: MSCI, S&P Global, Moody’s, Verisk, and traditional consulting or risk-advisory firms. Their products may not always feel as technically adventurous as those of startups, but their distribution moats are formidable and their event horizons cannot be easily obviated. They already sit inside investment, insurance, banking, and regulatory workflows. They possess unmistakable brand trust, procurement access, and the ability to bundle climate analytics into broader risk products.
MSCI’s scenario-analysis products, for example, are positioned to help investors quantify climate-related risks, optimize portfolio performance, and support reporting [24]. Moody’s and Verisk bring similar advantages from credit analytics and catastrophe modeling. The incumbent threat is therefore obvious. If climate-risk intelligence remains a compliance feature or a generic portfolio score, incumbents can absorb it. If the category becomes a domain of assetlevel physical modeling, peril-specific underwriting, and decision-grade adaptation planning, specialized companies have more room to excavate durable footholds.
9.6 Venture Interpretation
The competitive landscape is evidently reducible to a hierarchy of moats. The weakest moat is visual presentation, as something like a dashboard can be copied. A stronger moat is proprietary or difficult-to-recreate data. A still stronger moat is a validated model connected to losses, claims, asset performance, or operational outcomes. The strongest moat is a decision workflow whose recurrence makes the product difficult to remove.
The most attractive companies will likely exhibit compound defensibility. They will possess credible physical modeling, differentiated data access, validated uncertainty treatment, and integration into a budgeted workflow. Companies that possess only one of these traits may still be useful, but companies that possess several can become infrastructure that is indispensable to a broader mechanistic structure. In a sector where uncertainty is the product’s raw material, the deepest moat belongs to the firm that can make uncertainty both technically robust and commercially actionable.
10 Key Risks
Climate-risk intelligence is a compelling sector precisely because its object of study is unstable, economically material, and far from completely understood. The same traits that create the market also create the risks. A product may possess sophisticated models, polished interfaces, and a plausible buyer narrative while still failing to produce decision-grade intelligence. The key risks are therefore scientific, commercial, and institutional.
10.1 Model Risk
The first risk is that the model is less capable than the product implies. Physical climate hazards are nonlinear, spatially heterogeneous, and often most important in the tails. A model may perform adequately under average
conditions while failing in precisely the region where customer losses are most convex. This concern is especially acute for rare events, compound hazards, and out-of-distribution extremes. Recent work suggesting that several AI weather models underperform physics-based models for record-breaking events is a useful reminder that global forecasting skill can coexist with fragility in the tails [43]. For climate-risk intelligence, this is an existential issue. The product is often purchased to manage the consequences of the exceptional event, not the ordinary one.
10.2 Historical Data and Validation Risk
The second risk is that the historical record is too sparse, too short, or too uneven to support the confidence implied by the output. The satellite era is brief relative to the recurrence intervals of many severe hazards. Extreme events are sparse by construction. Local observations may be missing precisely where asset-level decisions must be made, or they may admit reanalysis data ensemble spread that is far too large to furnish an argument for reliable extrapolation. This creates a validation problem: short-term forecasts can be compared against frequent realizations, while long-horizon climate-risk projections must rely on hindcasts, stress tests, physical consistency, and large ensemble comparison. A product whose claims cannot be decomposed by hazard, geography, and time horizon should be treated with suspicion.
10.3 Vulnerability Translation Risk
The third risk is that a company may model hazards well but translate them poorly into damage, downtime, or loss. Exposure must not be conflated with loss. Two assets can experience the same flood depth or heat anomaly while exhibiting different consequences because of design, maintenance, redundancy, or local adaptation. The vulnerability layer is therefore a major point of hidden fragility. If the company relies on generic vulnerability functions, weak asset data, or poorly calibrated damage curves, the final risk score may inherit a veneer of precision from the hazard model while being economically untrustworthy. This is where many products are likely to look more scientific than they actually are.
10.4 Decision-Translation Risk
The fourth risk is that the product stops at intelligibility and never reaches actionability. A buyer may understand that an asset is exposed to flood, fire, heat, or drought while remaining uncertain about what to do next. ULI and LaSalle’s work on climate-risk analytics is useful here because it emphasizes the integration of risk outputs into real-estate life-cycle decisions rather than the mere procurement of analytics [37]. A company that cannot alter underwriting, lending, acquisition, divestment, or resilience-CapEx decisions is insufficient for the sake of satisfying a role of decision infrastructure.
10.5 Buyer and Budget Risk
The fifth risk is that the customer pain is real but the budget is diffuse. Climate-risk intelligence often touches risk teams, sustainability teams, operations teams, investment committees, and compliance functions. Diffuse ownership can slow procurement. A product that serves everyone in the organization may, in practice, be owned by no one. The strongest companies will attach to a budgeted workflow with a clear internal champion. The weakest will sell broad awareness into a category whose urgency is acknowledged but whose spending authority is ambiguous.
10.6 Commoditization Risk
The sixth risk is commoditization of the visible product layer. Hazard maps, exposure scores, and climate dashboards are increasingly easy to imitate at the level of presentation. Public datasets, open climate models, geospatial tooling, and cloud infrastructure lower the barrier to building something that looks credible. It is thus necessary to scrutinize a company to the end of determining if it possesses a defensible layer beneath the interface. Whether that manifests as proprietary data, validated vulnerability models, regulatory acceptance, workflow integration, or distribution is one thing, but without one of these moats, the product may become nothing more than a feature inside a larger financial-data, insurance, or enterprise-risk platform.
10.7 Trust and Liability Risk
The seventh risk is institutional trust. Climate-risk intelligence products can affect property values, credit decisions, insurance availability, and public perceptions of place. As these tools move from exploratory analysis into capital allocation, model legitimacy becomes commercially material. A false positive can impose unnecessary cost. A false negative can leave the customer exposed. A product used in banking, insurance, or real estate must therefore be
explainable enough to survive procurement, model-risk review, and external scrutiny. The more consequential the output, the less tolerance customers will have for a black box.
10.8 Timing Risk
The final risk is that the sector is directionally right but commercially early. Physical climate risk is becoming more salient, and the broader adaptation economy is expanding, yet enterprise adoption may remain uneven. Some customers may purchase analytics for disclosure before embedding them into live decisions. Others may wait for regulators, insurers, lenders, or competitors to force the issue. This is a classic game theoretic dilemma with a Nash equilibrium situated at the status quo. This creates a timing problem for venture-backed companies, as the market may be inevitable in a civilizational sense while still developing too slowly for a particular startup’s financing path.
10.9 Venture Interpretation
The best companies in the sector will be those that turn these risks into moats. Model risk becomes a moat if the company validates better than peers. Data risk becomes a moat if the company obtains proprietary asset or claims data. Translation risk becomes a moat if the company maps hazards into losses with unusual fidelity. Buyer risk becomes a moat if the product embeds itself inside a recurring workflow. The diligence task is therefore to ask which risks the company has merely described, which risks it has actually reduced, and which risks remain hidden behind the interface.
11 Diligence Questions
It must be addressed that the purpose of the diligence task in climate-risk intelligence is to determine whether a company has adequately performed the task of translation along the assembly line. This is an unavoidable part of determining a company’s acumen within the sector. The following questions are intended to separate products with genuine technical and commercial depth from those that merely display climate exposure in a persuasive interface.
Modeling and Physical Fidelity
- What hazards does the product model, and over which time horizons?
- Does the company rely on numerical models, AI/ML models, hybrid models, catastrophe models, or third-party data feeds?
- Is the model deterministic or probabilistic in nature?
- How does the product treat tail events, compound hazards, and nonstationarity?
- Is the model locally calibrated, or does it apply broad regional assumptions to asset-level decisions?
- What are the core modeling assumptions made and how might their affects propagate throughout the rest of the logic chain?
Uncertainty and Validation
- Does the product produce deterministic scores, probabilistic distributions, or scenario-conditioned outputs?
- What has been validated: hazard occurrence, asset damage, financial loss, or customer decision quality?
- What historical data, hindcasts, claims data, or realized-loss records support the model?
- Can the company explain where uncertainty enters and how it propagates through the stack?
Exposure, Vulnerability, and Loss Translation
- What asset-level data does the product require, and how complete or proprietary is that data?
- How does the company translate hazard intensity into vulnerability, damage, downtime, or expected loss?
- Are vulnerability functions generic, sector-specific, or calibrated against proprietary outcomes?
- Does the product distinguish between superficial exposure and genuine impairment?
Workflow and Buyer Value
- Which recurring decision does the product alter?
- Who owns the budget: underwriting, credit risk, asset management, operations, resilience, or compliance?
- Does the product integrate into existing systems, or does it require the buyer to create a new workflow?
- What action should the customer take after receiving the output?
- Commercial Defensibility
- What part of the stack is proprietary or difficult to replicate?
- Does the company possess unique data, validated models, regulatory acceptance, distribution, or workflow lock-in?
- Could an incumbent financial-data provider, catastrophe-modeling firm, or consulting platform replicate the visible product?
- Does pricing scale with seats, assets, hazards, workflows, risk transferred, or economic value created?
12 Conclusion: Where One Should Seek Venture-Scale Opportunities
Climate-risk intelligence is most compelling where physical risk has become financially unavoidable but remains analytically difficult to price. The sector should not be pursued through generic dashboards or broad exposure scores. The best opportunities will be observed in the form companies that convert uncertain physical hazard information into recurring, budgeted decisions.
The most attractive companies will likely possess three traits. First, they will have a technically credible method for representing hazard distributions, vulnerability, and loss under uncertainty. Second, they will attach to a buyer whose pain is already expressed in dollars, downtime, risk transfer, or regulatory scrutiny. Third, they will embed outputs into a workflow that repeats, all while becoming inseparable from said workflow. In this sector, venture-scale opportunity will emerge from owning the analytical layer through which customers decide what to do about a climate hazard.
The most promising wedges are therefore insurance and reinsurance analytics, asset-level risk intelligence for real estate and infrastructure, credit-risk tools for banks and lenders, and operational adaptation platforms for exposed industries. Each of these markets contains customers with recurring decisions and material downside. The core tenets encode translation from hazard to exposure, from exposure to vulnerability, from vulnerability to loss, and from loss to action.
The final diligence standard is simple. A climate-risk intelligence company is worth pursuing when its product makes physical uncertainty more usable than its competitors can. Namely, beyond the scope of merely visualizing risk, a company that changes the price of risk, the allocation of capital, or the design of adaptation can become indispensable.
References
[1] Baldi, D., et al., “The Future of Climate Tech 2026: At the Nexus of AI, Energy and Decarbonization”, Silicon Valley Bank Signature Research, April 2026.
[2] Barrick, J., “A Market Map of Tech Solutions for Climate Adaptation and Resilience”, SJF Ventures News & Insights, July 17, 2024.
[3] Bi, K., Xie, L., Zhang, H., Chen, X., Gu, X., and Tian, Q., “Accurate Medium-Range Global Weather Forecasting with 3D Neural Networks”, Nature, Vol. 619, pp. 533-538, 2023.
[4] Bodnar, C., et al., “A Foundation Model for the Earth System”, Nature, Vol. 641, pp. 1180-1187, 2025.
[5] Climate X, “Physical Climate Risk Analysis - Spectra by Climate X”, Climate X, accessed May 2026.
[6] Demex Group, The, “About”, The Demex Group, accessed May 2026.
[7] First Street, “First Street API Documentation”, First Street Documentation, accessed May 2026.
[8] First Street Technology, Inc., “First Street Expands Climate Risk Coverage from Real Estate to Companies and Infrastructure”, PR Newswire, April 27, 2026.
[9] First Street, “Licensing First Street Data”, First Street Help Center, accessed May 2026.
[10] FloodFlash, “Parametric Underwriting at FloodFlash”, FloodFlash, June 20, 2024.
[11] Fortune Business Insights, “Climate Risk Analytics Market Size, Share & Industry Analysis”, Fortune Business Insights Report, Report ID FBI116031, May 4, 2026.
[12] Freedman, A., “First Look: ClimateCheck Inks Deal with Black Knight for Climate Risk Analytics”, Axios, December 5, 2022.
[13] Jupiter Intelligence, “Climate Resilience Experts”, Jupiter Intelligence, accessed May 2026.
[14] Kettle, “Balancing Risk in a Changing Climate”, Kettle, accessed May 2026.
[15] Kochkov, D., et al., “Neural General Circulation Models for Weather and Climate”, Nature, Vol. 632, pp. 1060-1066, 2024.
[16] Lam, R., Sanchez-Gonzalez, A., Willson, M., et al., “Learning Skillful Medium-Range Global Weather Forecasting”, Science, Vol. 382, No. 6677, pp. 1416-1421, 2023.
[17] Lee, L.-E., Ashfaq, U., Baatarchuluu, T., and Yeung, L., “The Hidden Adaptation Economy: A New View of Corporate Resilience and Opportunity”, MSCI Institute, March 18, 2026.
[18] Lee, L.-E., Marchand, O., and Bowdrey, R., “What the Market Thinks: Investors Envision Escalating Risks of Extreme Weather”, MSCI Institute, October 31, 2024.
[19] Lee, L.-E., Towey, K., and Ashfaq, U., “What the Market Thinks: Findings from Our Corporate Resilience Survey”, MSCI Institute, October 29, 2025.
[20] Lehmann, J., Bowdrey, R., Wang, X., and Eichler, L., “Hidden in Plain Sight: Physical Risk in Asset Owners’ Portfolios”, MSCI Research Paper, November 3, 2025.
[21] Mahmood, R., Palena, P., and Carlin, D., “What the Market Thinks: How Global Insurers Are Responding to Rising Physical Risk”, MSCI Institute, February 26, 2026.
[22] Mandelbrot, B. B., “Les objets fractals: forme, hasard et dimension”, Flammarion, Paris, 1975.
[23] Moody’s RMS, “Introduction to Climate on Demand”, Moody’s RMS Developer Documentation, accessed May 2026.
[24] MSCI, “Scenario Analysis”, MSCI, accessed May 2026.
[25] Network for Greening the Financial System, “NGFS Climate Scenarios Technical Documentation”, NGFS, January 2025.
[26] NOAA National Environmental Satellite, Data, and Information Service, “How Reliable Are Weather Forecasts?”, NESDIS K-12 Education, August 26, 2025.
[27] Oehling, D., Fischer, G., Sivaprasad, D., Nanji, T., Shandal, V., Sheridan, B., Chua, H. L., Zimmermann, F., Teo, J., Teo, M., and Lim, H., “The Private Equity Opportunity in Climate Adaptation and Resilience”, Boston Consulting Group, May 6, 2025.
[28] Office of the Superintendent of Financial Institutions and Autorité des marchés financiers, “Strengthening Climate Risk Financial Resilience: Insights from the Standardized Climate Scenario Exercise”, Climate Risk Report, September 11, 2025.
[29] Price, I., Sanchez-Gonzalez, A., Alet, F., et al., “Probabilistic Weather Forecasting with Machine Learning”, Nature, Vol. 637, pp. 84-90, 2025.
[30] Rasp, S., Hoyer, S., Merose, A., et al., “WeatherBench 2: A Benchmark for the Next Generation of Data-Driven Global Weather Models”, Journal of Advances in Modeling Earth Systems, Vol. 16, No. 6, 2024.
[31] Salient Predictions, “AI-Powered Weather Intelligence from 1 Day to 1 Year Ahead”, Salient Predictions, accessed May 2026.
[32] Swiss Re Institute, “2025 Marks Sixth Year Insured Natural Catastrophe Losses Exceed USD 100 Billion, Finds Swiss Re Institute”, Swiss Re Group Press Release, Zurich, December 16, 2025.
[33] Task Force on Climate-related Financial Disclosures, “Recommendations of the Task Force on Climate-related Financial Disclosures”, Final Report, June 2017.
[34] Technavio, “Climate Risk Analytics Platforms Market Analysis, Size, and Forecast 2026-2030”, Technavio Market Research Report, SKU IRTNTR81318, May 2026.
[35] Tomorrow.io, “The World’s Weather Intelligence & Resilience Platform”, Tomorrow.io, accessed May 2026.
[36] Trittipo, A., Ahlawat, H., Mysore, M., Kalavar, S., and Kane, S., “Climate Resilience Technology: An Inflection Point for New Investment”, McKinsey & Company, September 29, 2025.
[37] Urban Land Institute and LaSalle Investment Management, “How to Choose, Use, and Better Understand Climate-Risk Analytics”, ULI Knowledge Finder, September 14, 2022.
[38] Urban Land Institute and LaSalle Investment Management, “Physical Climate Risks and Underwriting Practices in Assets and Portfolios”, ULI Knowledge Finder, April 12, 2024.
[39] Verisk, “Catastrophe and Risk Solutions”, Verisk, accessed May 2026.
[40] Wong, D. R., and Kim, K. B., “Sizing the Inevitable Investment Opportunity: Climate Adaptation”, GIC ThinkSpace, May 2, 2025.
[41] XDI, “The Physical Climate Risk Experts”, XDI, accessed May 2026.
[42] ZestyAI, “Resources”, ZestyAI, accessed May 2026.
[43] Zhang, Z., Chantry, M., Magnusson, L., et al., “Physics-Based Models Outperform AI Weather Forecasts of Record-Breaking Events”, Science Advances, Vol. 12, No. 17, 2026.
[44] Zillow Group, “Zillow Introduces First Street’s Comprehensive Climate Risk Data on For-Sale Listings Across the US”, Zillow Group Investor Relations, September 26, 2024.